Watch Auckland transform from zoning reform
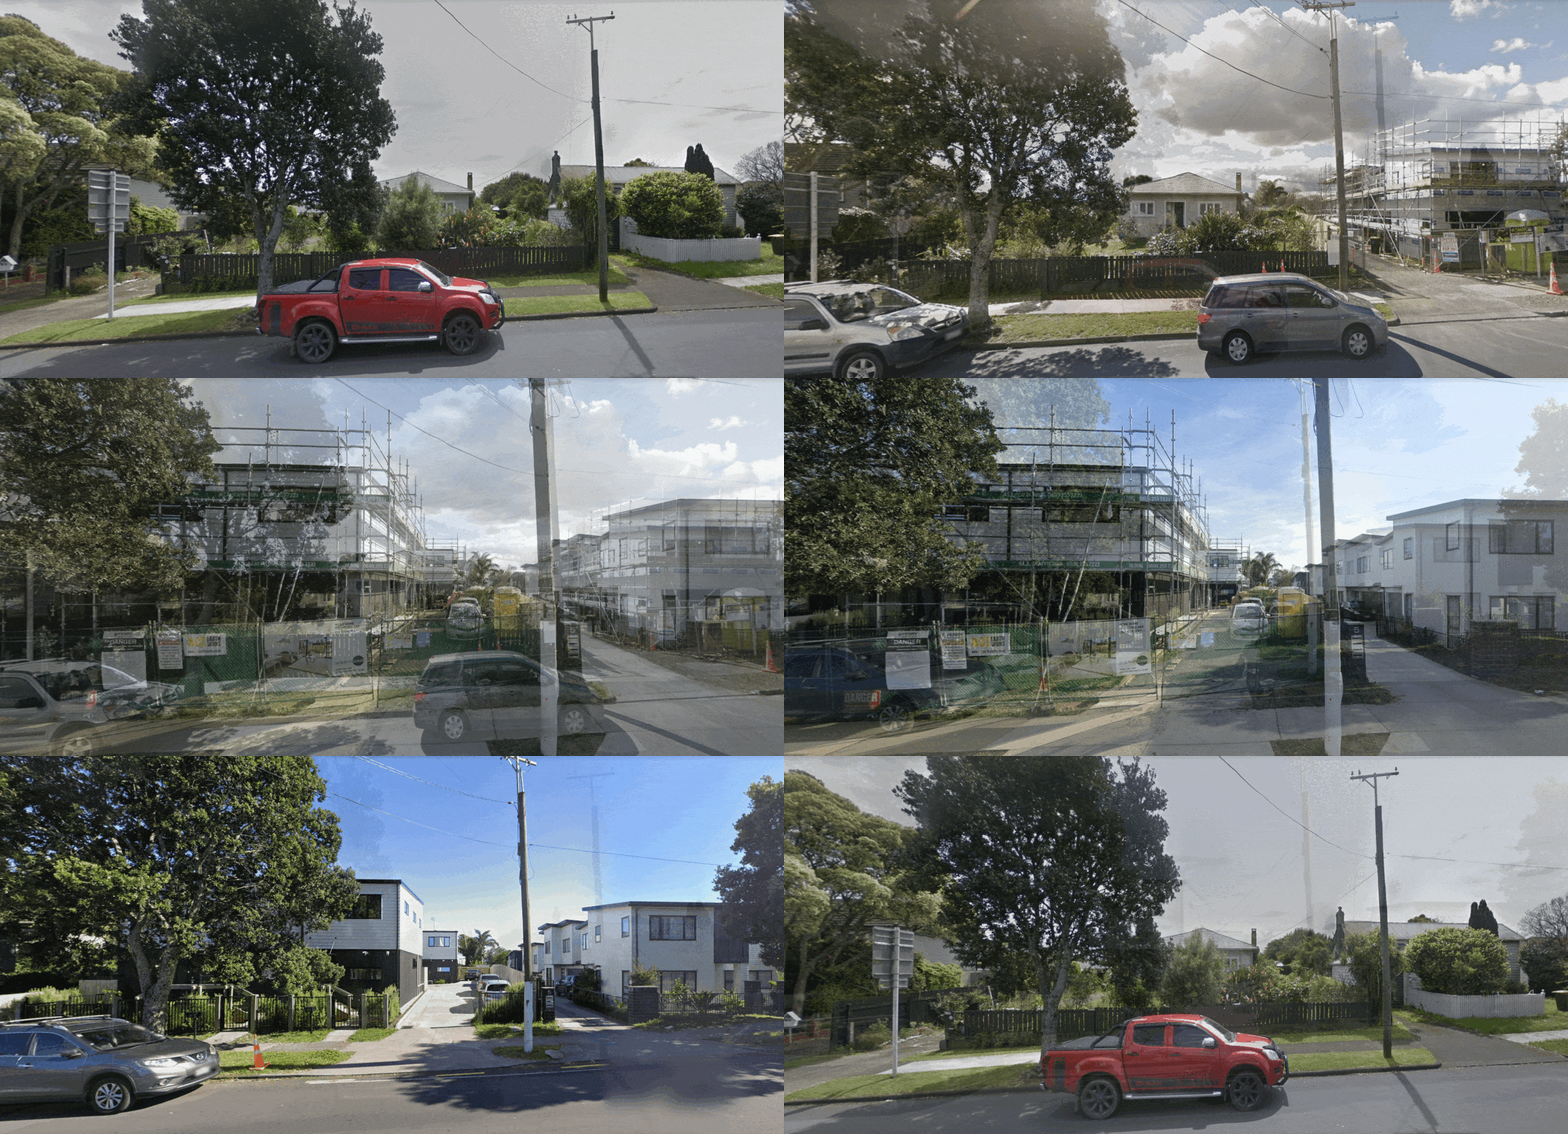
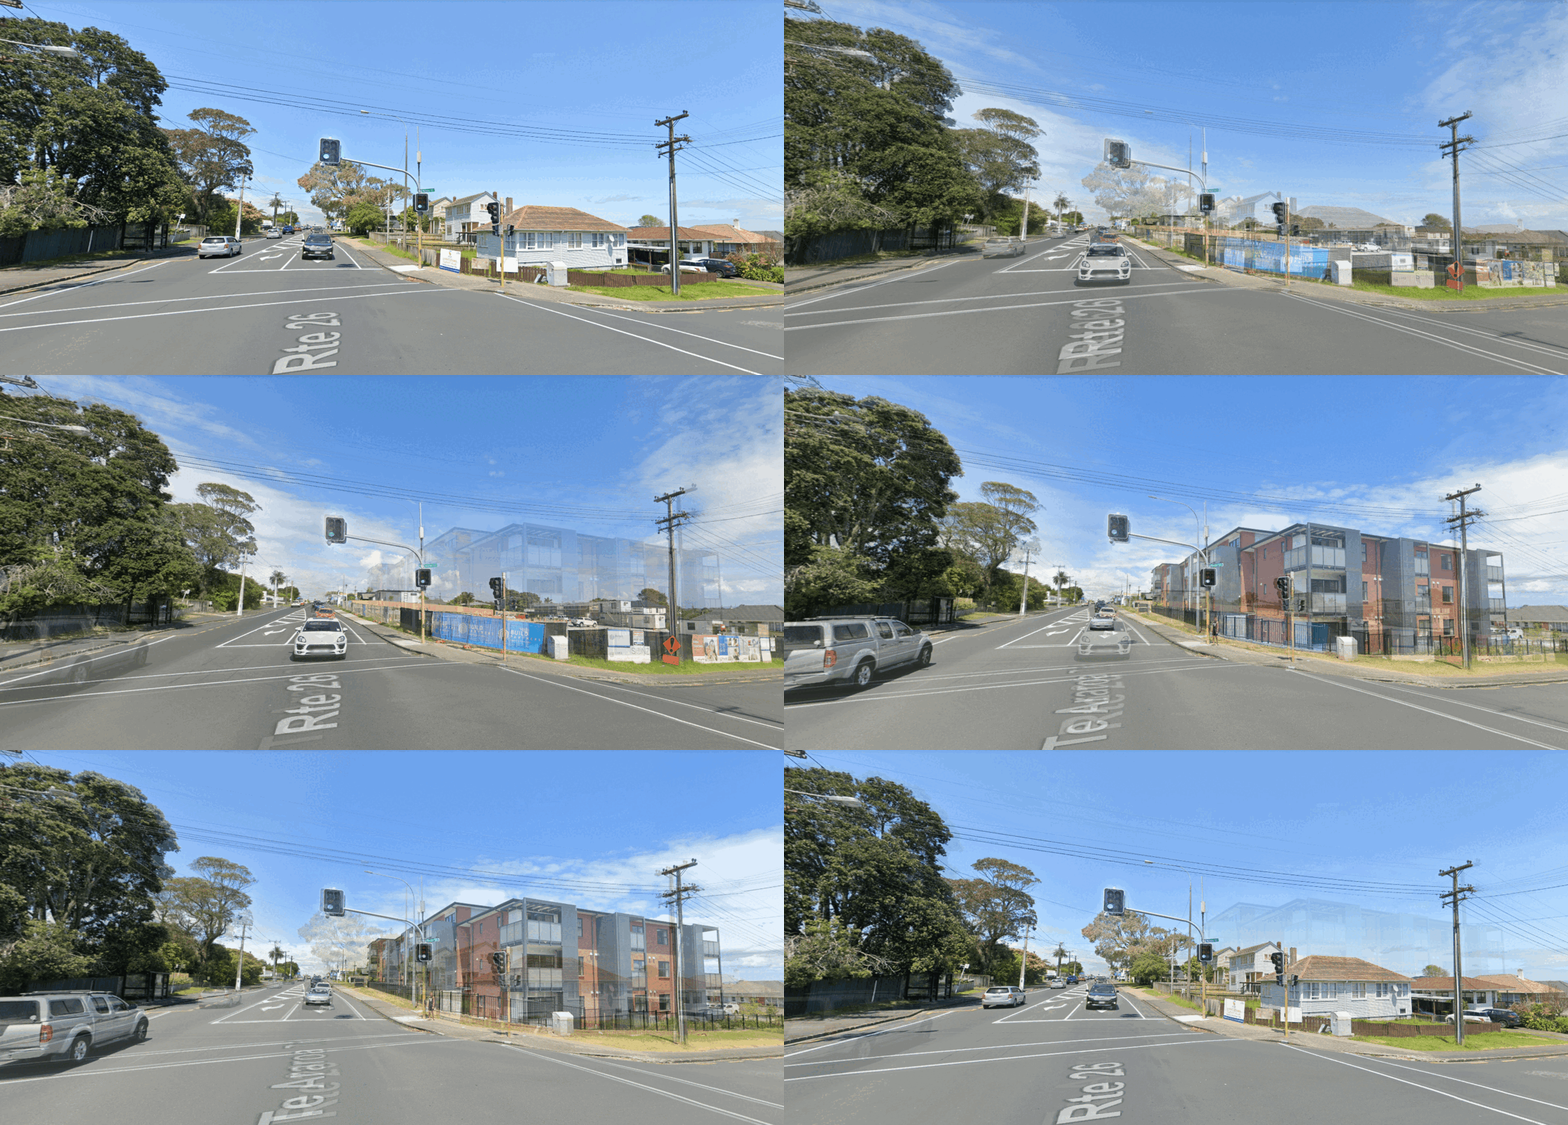
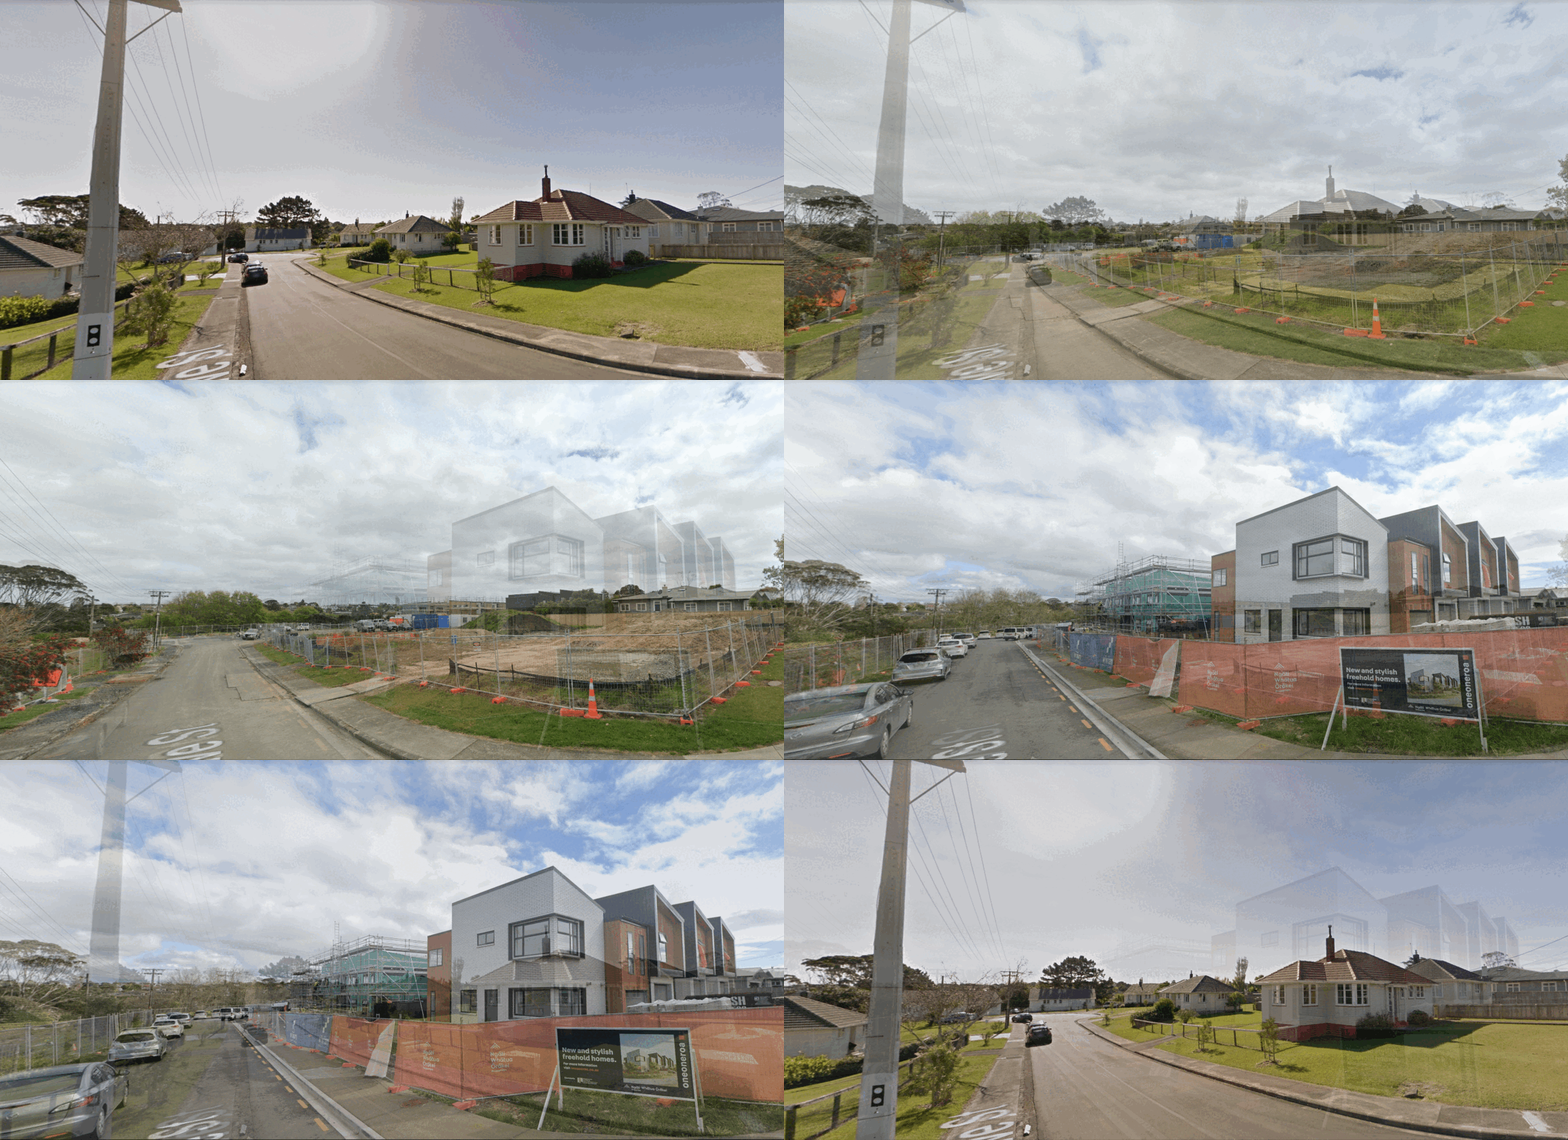
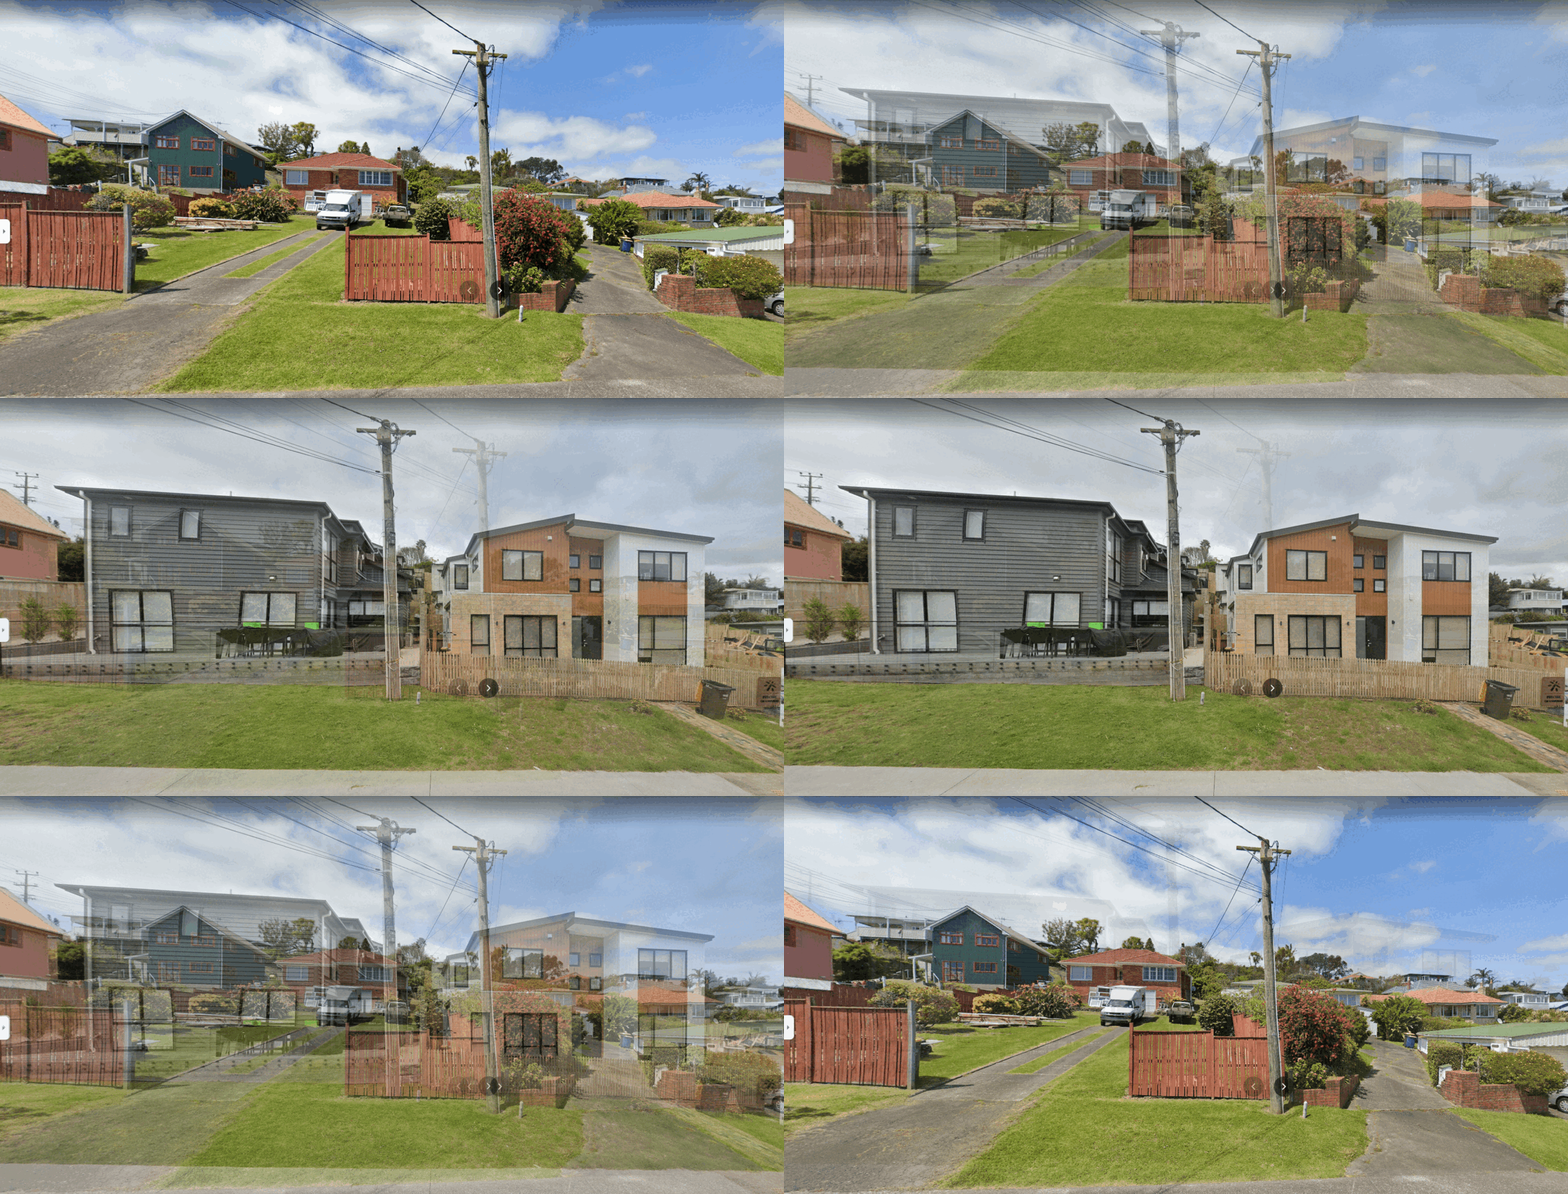
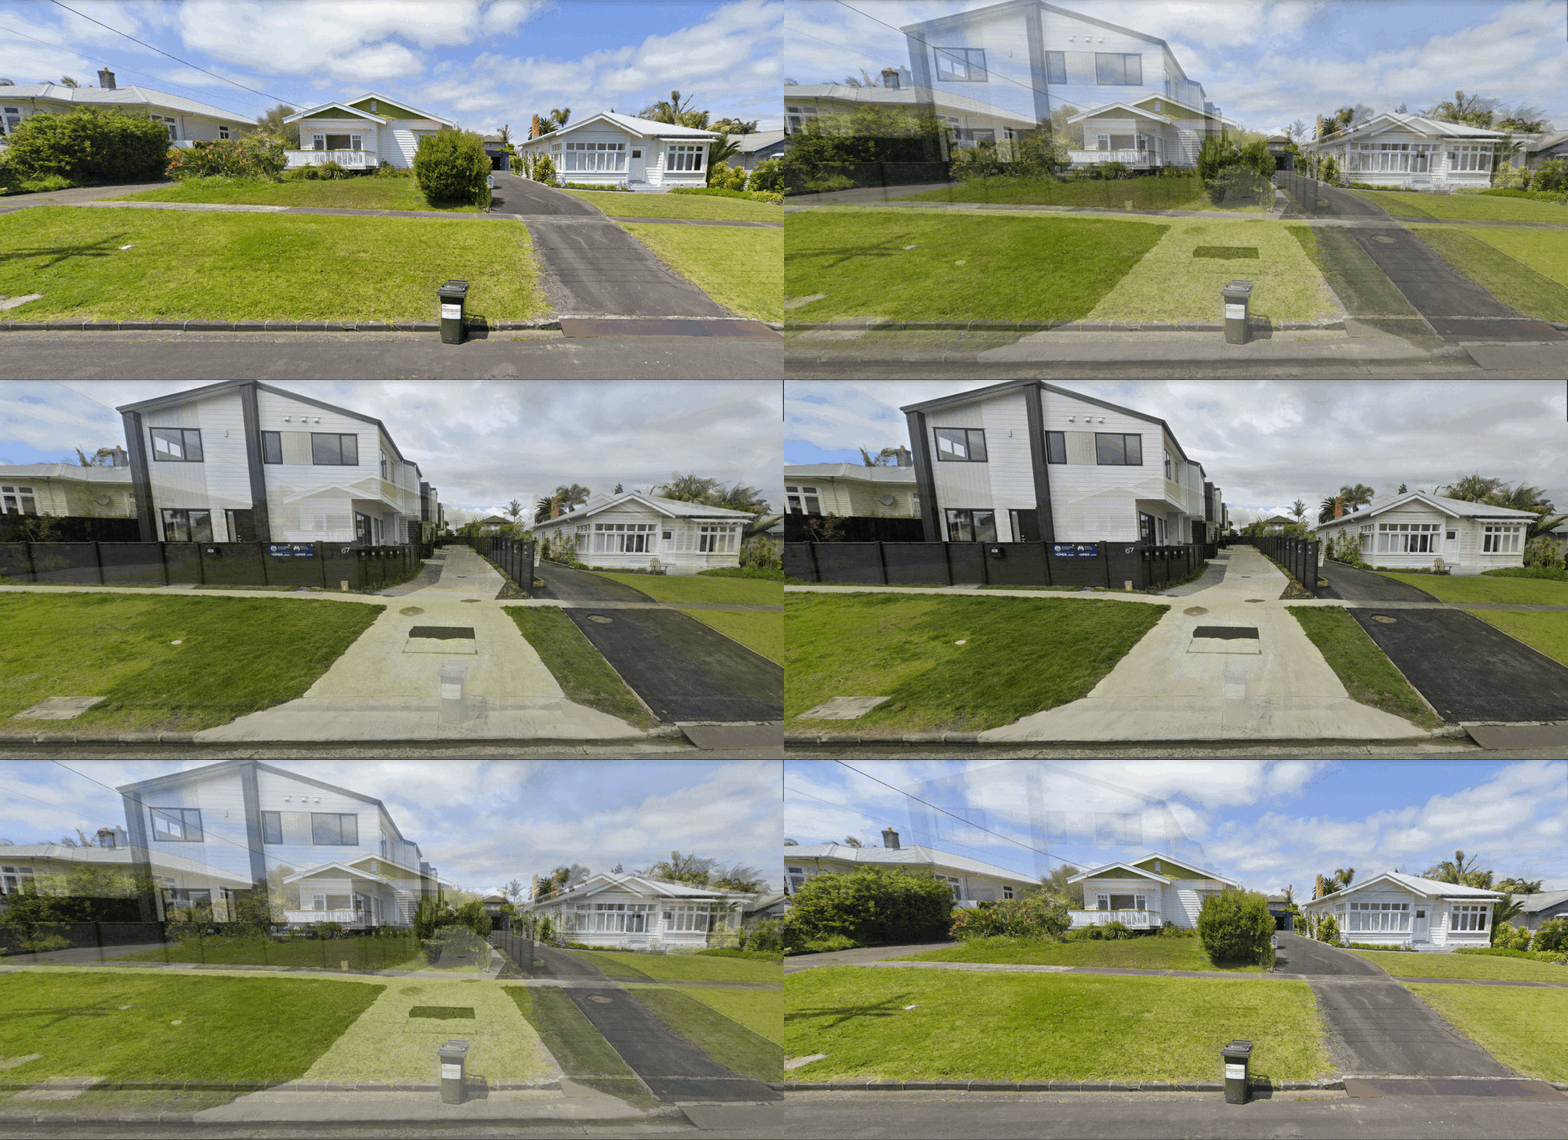
A bit of a different post this week. No data, charts, or econometrics. I’m just going to show you various parcels of land in Auckland transform in response to the Auckland Unitary Plan, implemented in 2016.
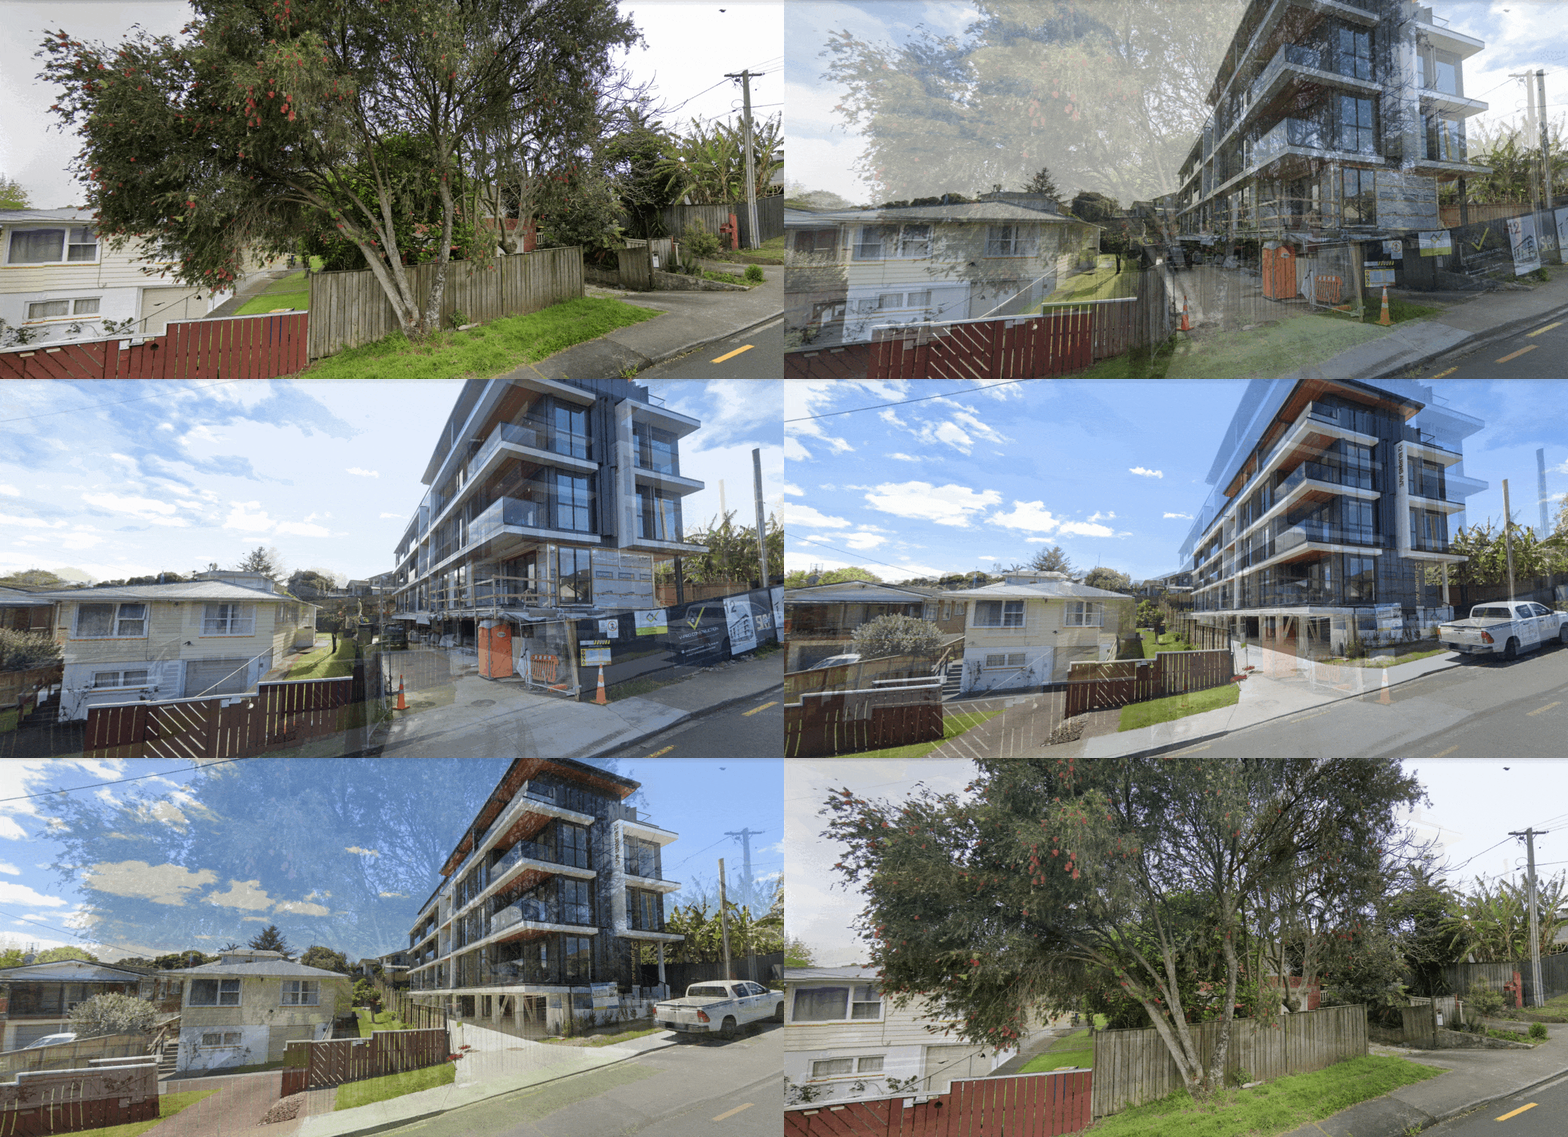
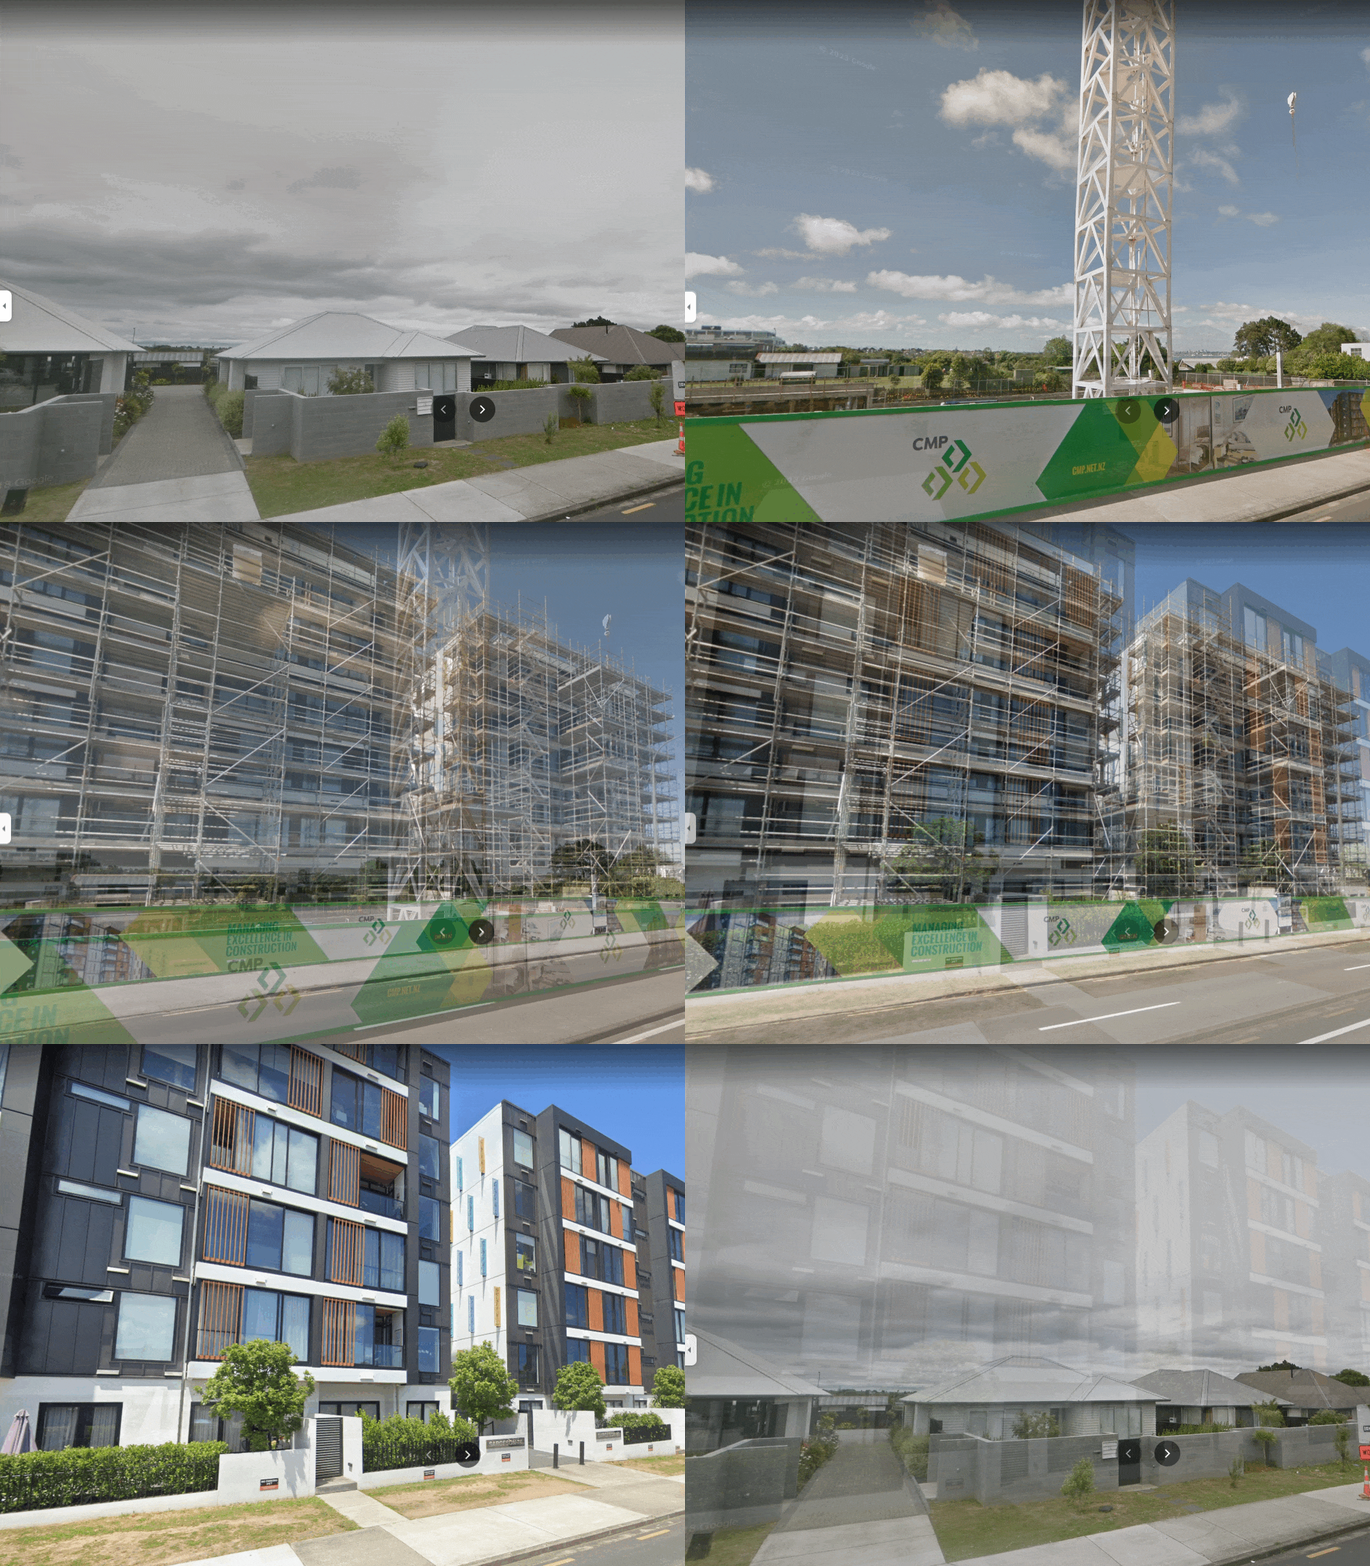
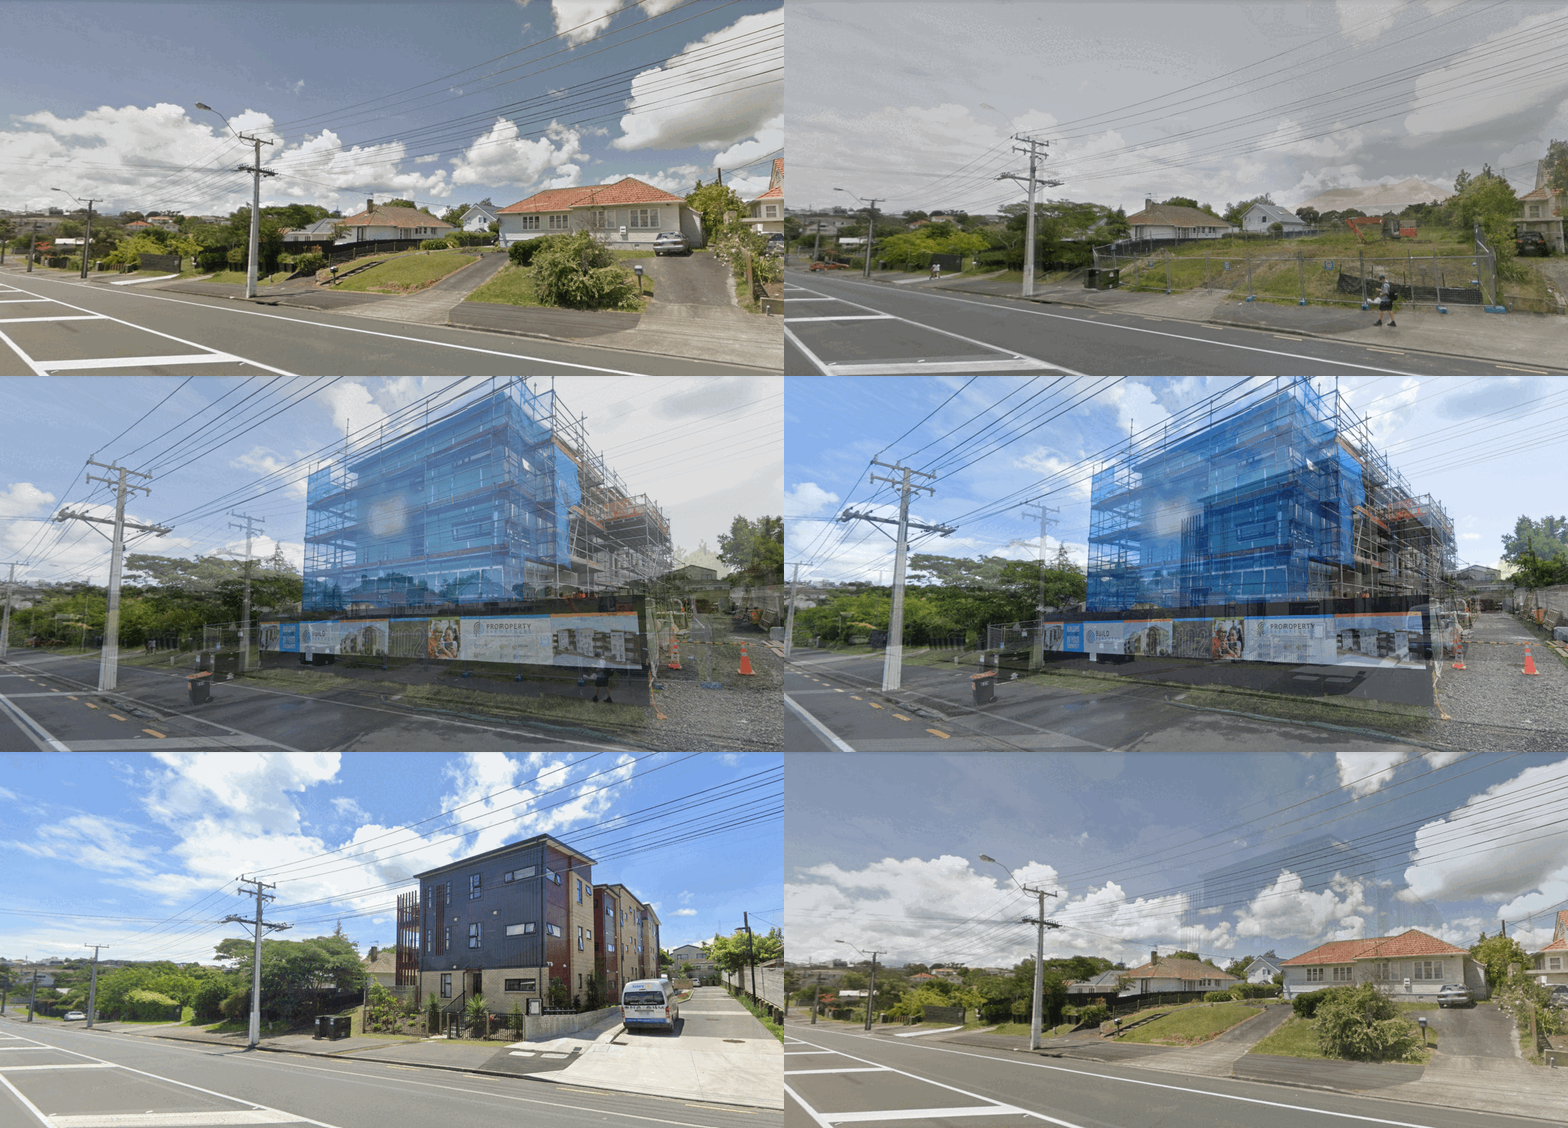
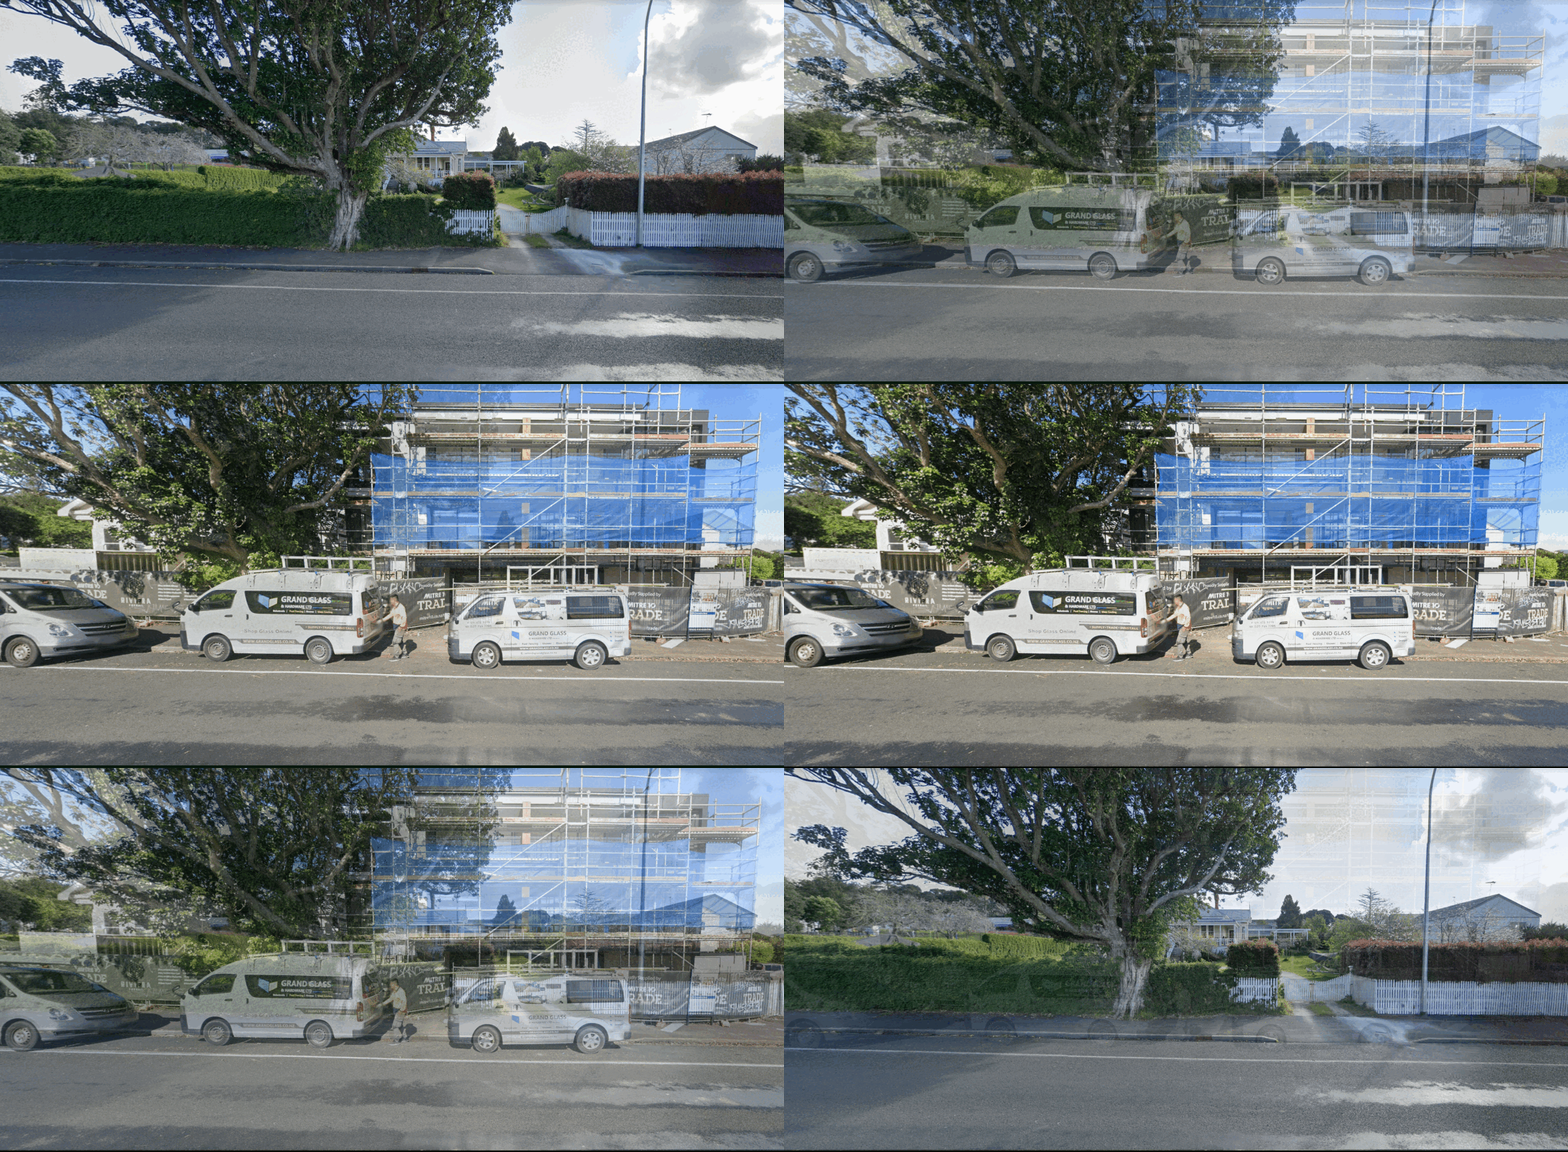
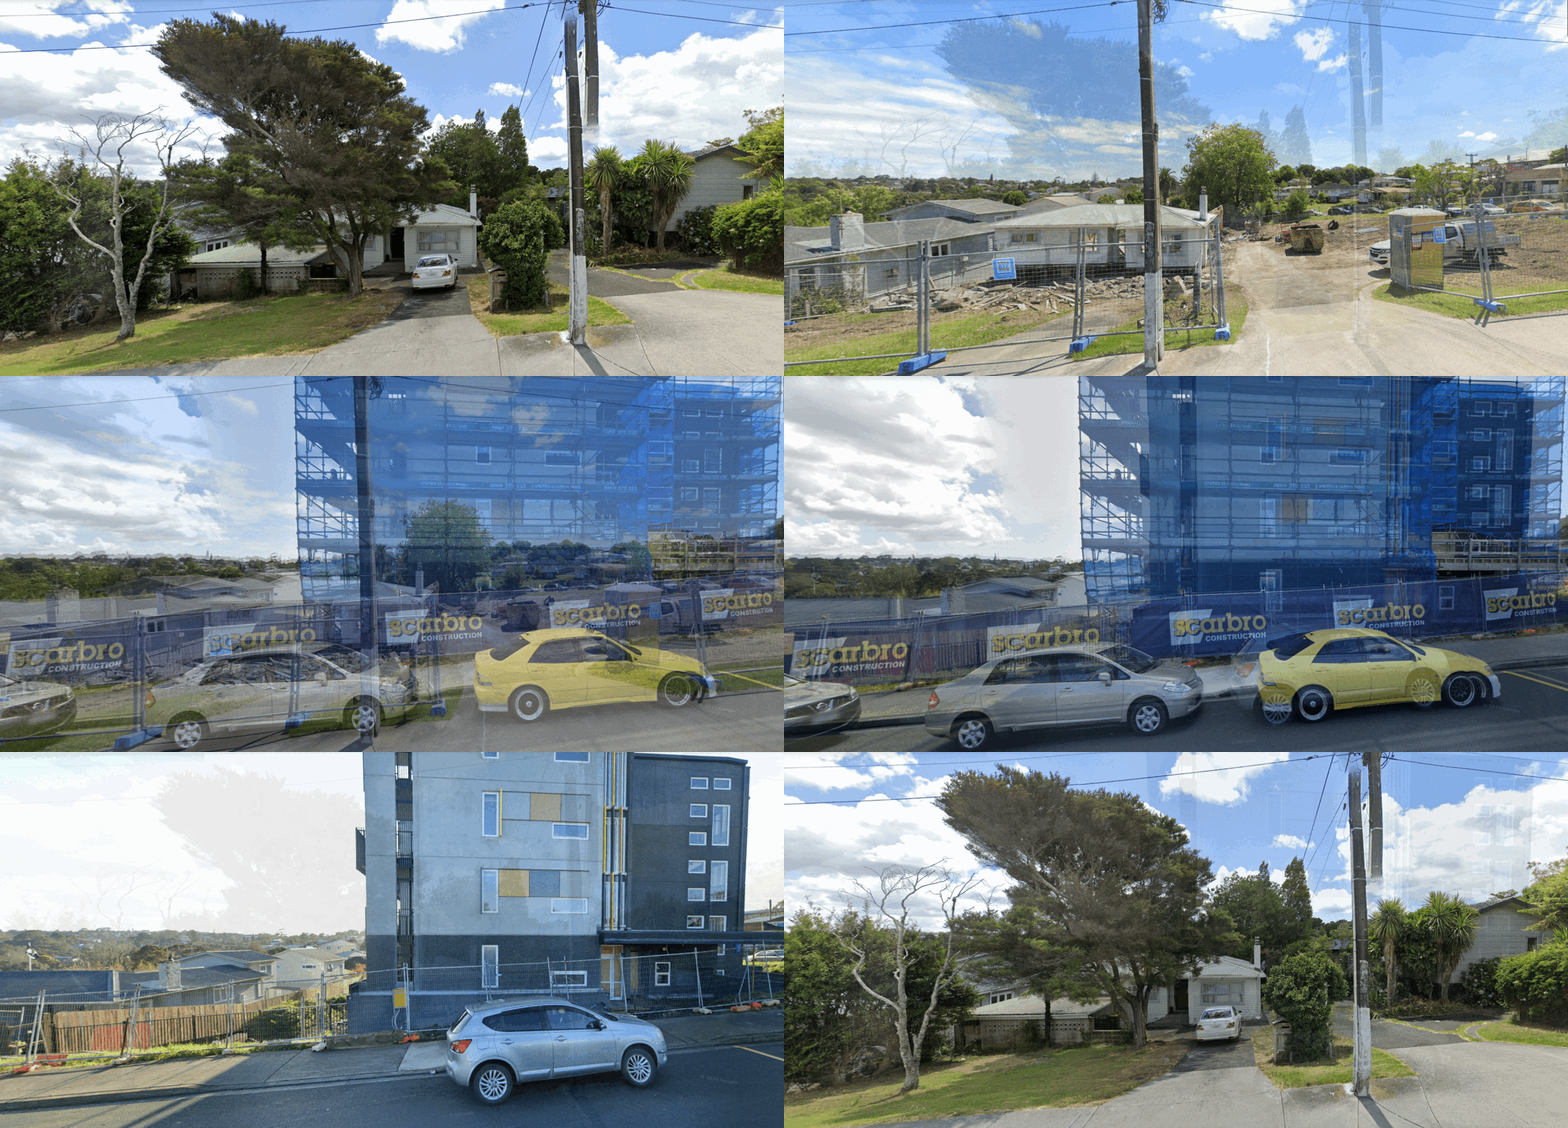
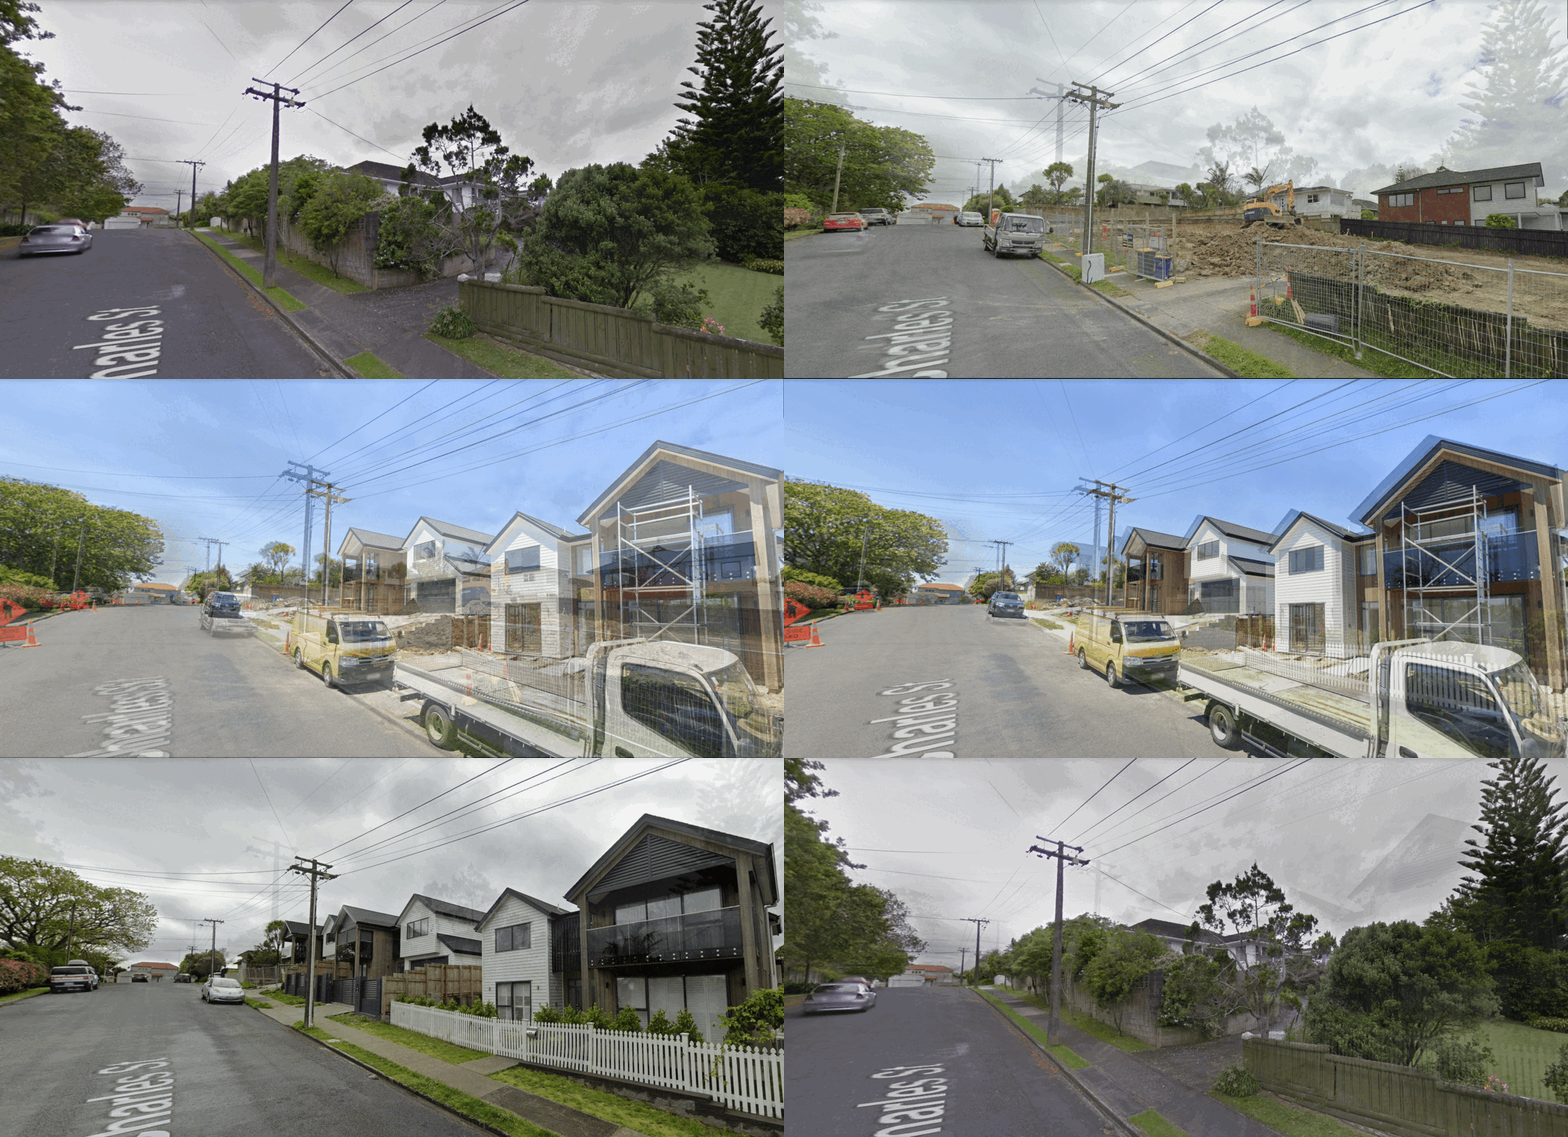
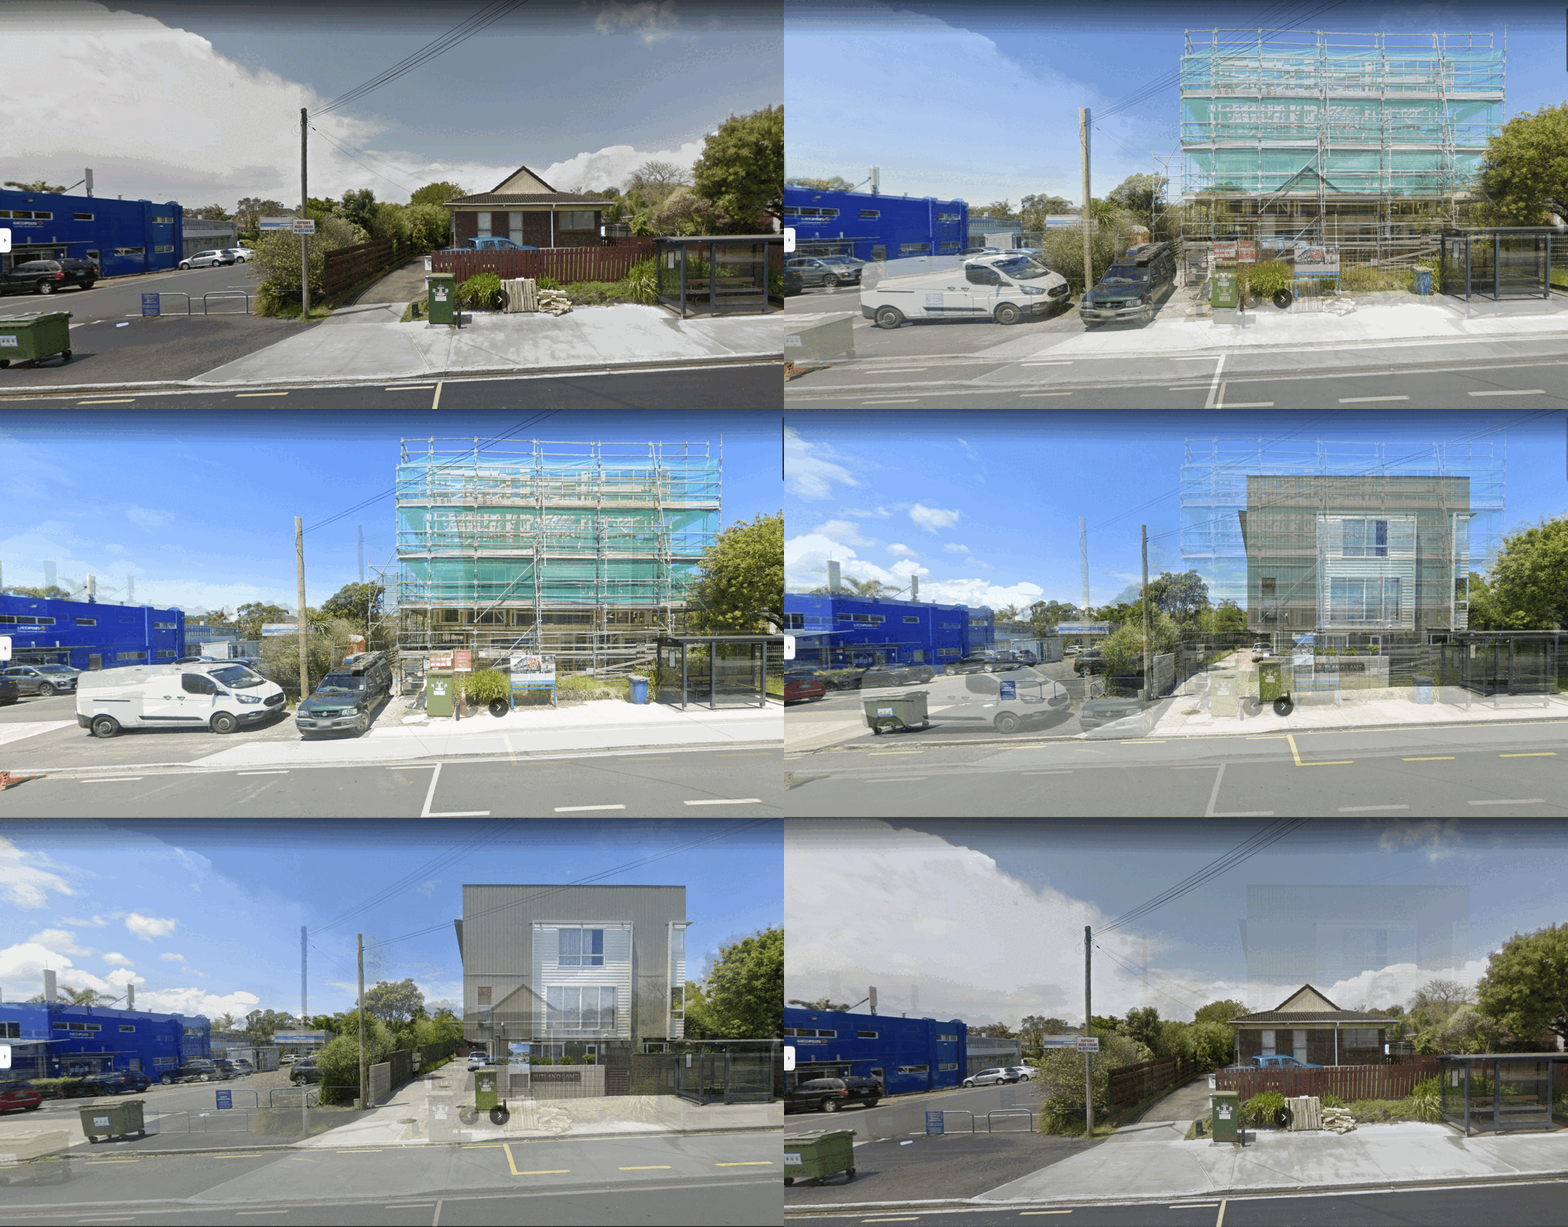
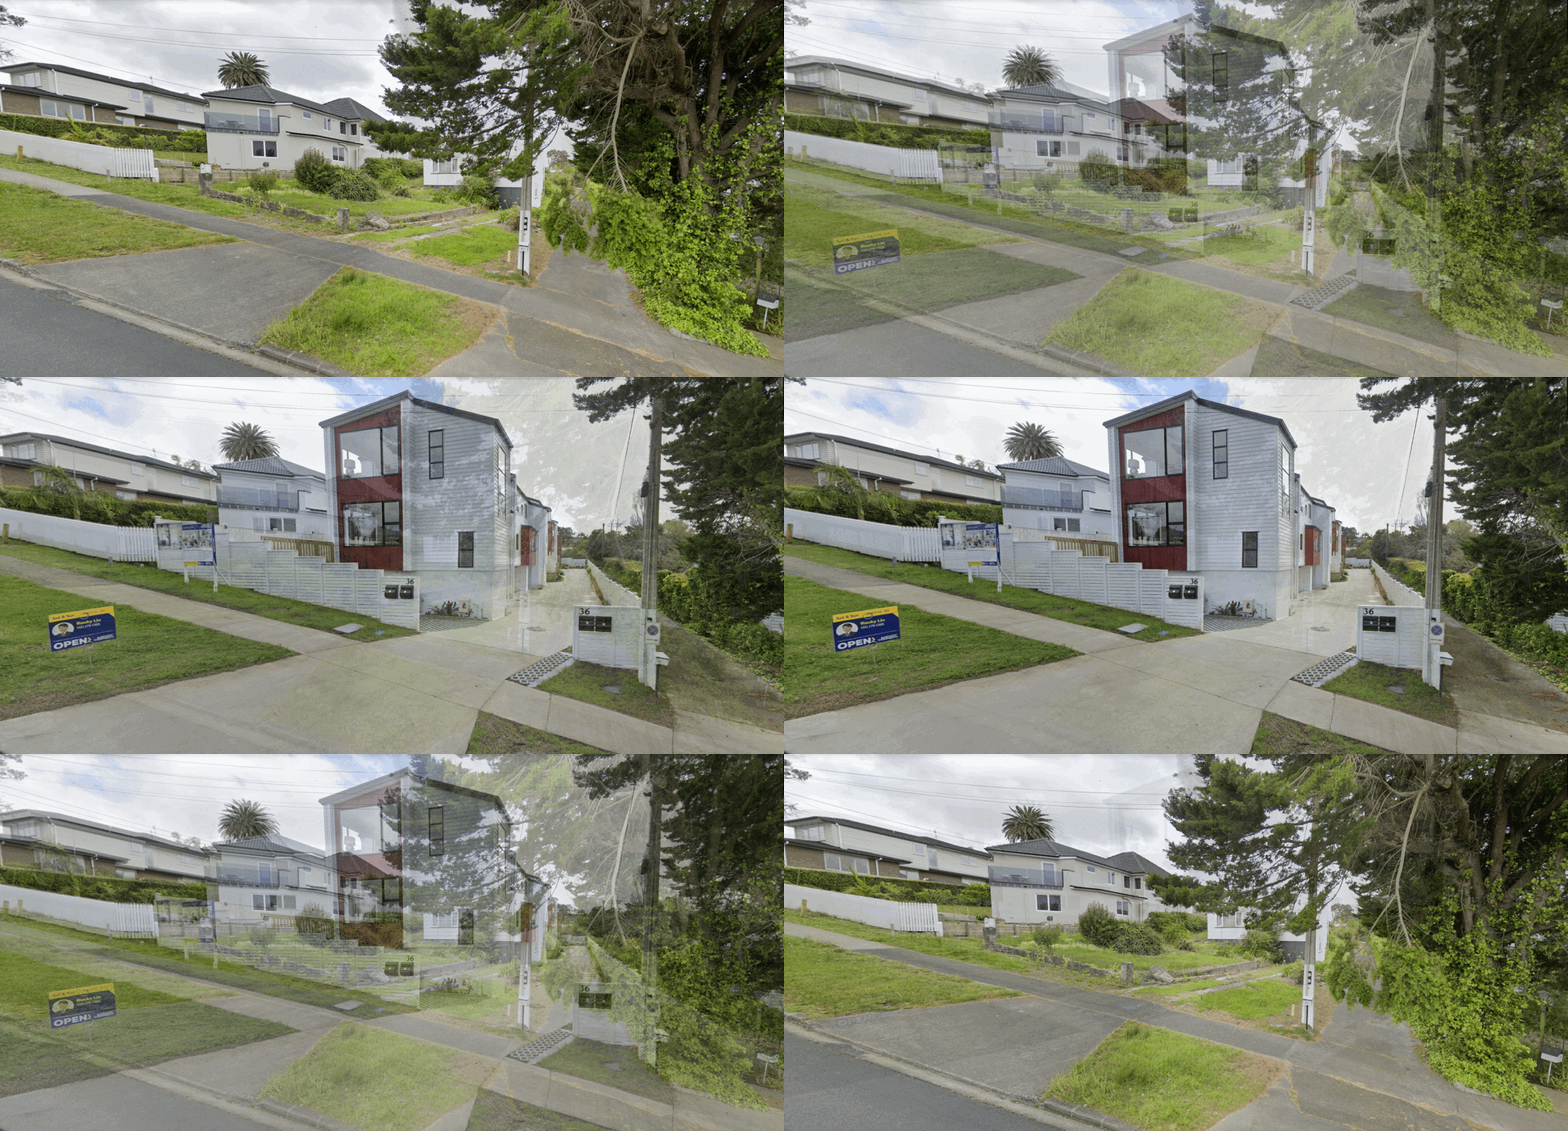
The data are very compelling that upzoning increased housing supply substantially, and likely resulted in lower rents. But, what I didn’t appreciate until I saw what was actually being built was just how more efficiently land was being utilised. The houses being replaced often are small dwellings on large blocks. In one case a suburban carpark appears to have been turned into ~36 homes.
These sites are also reasonably well located, often being close to shops, not too far from the CBD, and from eyeballing google maps there seems to often be bus lines nearby.
Another element is how these reforms have allowed for not just market-rate housing, but new State (i.e. Social) Housing developments as well.
Under each site I’ve attached the google maps links, where you can go and use the “view different dates” function to check out how these developments, and their surrounding areas, have changed over time.
A big thanks to Ryan Greenaway-McGrevy for sending through the google maps links to these development sites. If you know of any other examples of sites upzoned from the AUP and you would like to send me a link, I’d be happy to update this page as a resource for those interested.
(For mobile users, you may benefit from turning your phone landscape for a better viewing experience).
https://goo.gl/maps/LkFpqW254D9ML4sN9
State Housing Development. 8.8km from the Auckland CBD
https://goo.gl/maps/haqH5Za6xt2FWYFw6
11.5km from the Auckland CBD
https://goo.gl/maps/AF3JQEkGsXHvG4Fo8
12.1km from the Auckland CBD
https://goo.gl/maps/vNLaMXRfpQoih9VT8
14km from Auckland CBD
https://goo.gl/maps/qEUTCRKPdN9Cx5xu7
Non-for Profit Housing: 14.3km from the Auckland CBD.
https://goo.gl/maps/xZdf3R1S49f8XeHWA
20km from Auckland CBD
https://goo.gl/maps/UMVZMV7jeAicFf2F6
19.5km from Auckland CBD
https://goo.gl/maps/yAUzvdPwBEPm8nuT6
State Housing: 12.1km from Auckland CBD
https://goo.gl/maps/jcZrWf8tiwCFfe5h8
13.6km from Auckland CBD
https://goo.gl/maps/ER5bVqzWfyLDvMyn6
15km from Auckland CBD
https://goo.gl/maps/Xv6LNfi72NSumhDX7
14.2km from Auckland CBD
https://goo.gl/maps/n9Y4X8njvzjv3QSG7
12.1km from Auckland CBD
https://goo.gl/maps/3xaehqM4aV4tRmtv8
12.2km from Auckland CBD
https://goo.gl/maps/ghmNsmFXGq3xRzXC8
13.7km from Auckland CBD
https://goo.gl/maps/KsgZrLPfz4Z3orVG9
14.3km from Auckland CBD
https://goo.gl/maps/3bygoAAyzWYt6y698
13.8km from Auckland CBD
https://goo.gl/maps/Rsivwsu72AVnJJ5N6
13.9km from Auckland CBD
https://goo.gl/maps/EFnEwL8wbceYwStq5
12.7km from Auckland CBD
https://goo.gl/maps/gGmUGQ1EhLsVLuY5A
12.6km from Auckland CBD
https://goo.gl/maps/McpbQow54dz1JaFs8
12.2km from Auckland CBD
https://goo.gl/maps/r8vJRoDRK8YcTVVo8
13km from Auckland CBD
https://goo.gl/maps/ziMXrzrfxbVpFJk56
12.8km from Auckland CBD
https://goo.gl/maps/8roA6z5VzX89d7beA
15.3km from Auckland CBD
https://goo.gl/maps/N42TjWKc1nWacZTc9
15.1km from Auckland CBD
https://goo.gl/maps/XN6cWhpXi5mejTHt9
15.1km from Auckland CBD
https://goo.gl/maps/9mRZEqhiMRwJ6KPK6
11.8km from Auckland CBD
https://goo.gl/maps/77hyAo1tF8j8gsNV8
13km from Auckland CBD
https://goo.gl/maps/tQurfwVWKNm3oUfR8
3.2km from Auckland CBD
https://goo.gl/maps/QT7bujEK5JEUYsnSA
3.4km from Auckland CBD
https://goo.gl/maps/Z89tLcHyw6gZtsNY6
4.1km from Auckland CBD
If you have any other sites from the AUP you’d like to share, tweet me @1finaleffort, drop a comment below, or email me at onefinaleffortblog@gmail.com

