Housing Deep Dive #1: How important are vacant homes?
This is the first in a series of posts providing deep analysis on common (mis)conceptions in the Australian housing discourse. If you would like to see me cover a particular topic, email me at: onefinaleffortblog@gmail.com, or get in touch on twitter @1finaleffort. Usual Disclaimer: The views in this post are my own, and don’t represent my employer or any organisation.
Summary:
It is often argued that Australia has many vacant houses. This view is often presented in support of anti-upzoning positions, arguing that we should make better use of existing homes instead of building new ones.
The claim that Australia has a sizeable stock of vacant houses is based upon two data sources that estimate 5 to 10% of houses are vacant. However, these figures are based on questionable assumptions that overestimate the actual vacant housing stock, which is probably around 1.5% of homes, or even lower.
Despite claims that vacancy is a deliberate decision by the owner (“speculation”) there is little solid evidence on why houses are left vacant. In many cases vacancy is a sub-optimal state forced onto the property owner. Examples of this could be unresolved deceased estates, credit constraints when undergoing renovations, or planning delays.
·A vacancy tax could help bring some long-term vacant houses back to the market. But international evidence suggests the impact of a tax would probably be small.
·A back-of-the-envelope estimate suggests that a vacancy tax would only reduce rents and prices by a percent or less. While not negligible, this effect is minor compared to the impact of zoning. There simply aren’t enough vacant homes to have much of an impact.
Introduction:
Australia doesn’t have a housing supply problem, it has a housing distribution problem. We have hundreds of thousands of houses sitting empty during a rental crisis. If we simply put our empty stock to use, we could clear our social housing waitlists and then some, driving down rents. The problem is that speculators – or landbankers – buy up houses, leave them vacant, watch them appreciate, and bank the capital gains.
The above argument is increasingly presented in the Australian housing discourse, to varying degrees. It’s somewhat intuitive and appears to be supported by data suggesting 5 to 10% of housing stock is unused at a given time. It’s also a convenient argument for those against zoning-reform. If we can simply free up unused housing stock, we don’t have to make tough decisions to increase density.
But is this true? Are a significant number of houses really sitting vacant year-round, accumulating dust and capital gains? In this blog post, I’ll attempt to have a look at the data and economic evidence on vacant housing, and find out.
What is a vacant house?
First, let's clarify our definitions. We're not talking about rental vacancies here, which refer to properties available for lease at a given time. Instead, we mean houses that are literally vacant: unoccupied and without inhabitants.
But, we probably don’t care about all unoccupied houses. Some can be unoccupied briefly due to moves or renovations. This is a natural function of housing markets, and often a net positive for the quality and availability of our housing stock. Given we’re moreso interested in houses which policy can ‘return’ to the housing market, ideally we’d like to exclude these “temporarily” vacant dwellings from any count.
It's also tempting to include second homes, holiday homes, or AirBNBs in this category. Some argue that these houses are vacant for much of the year and could be better used as primary residences. However, they are not technically 'vacant' in the same manner, since they serve some use, and are likely concentrated in particular locations - where people may not want to live – and so can’t be driving nationwide affordability concerns. Furthermore, the policy measures available to address them differ from potential policies for fully vacant houses. Therefore, this blog post will exclude these houses from our analysis – although I may return to them at a later time.
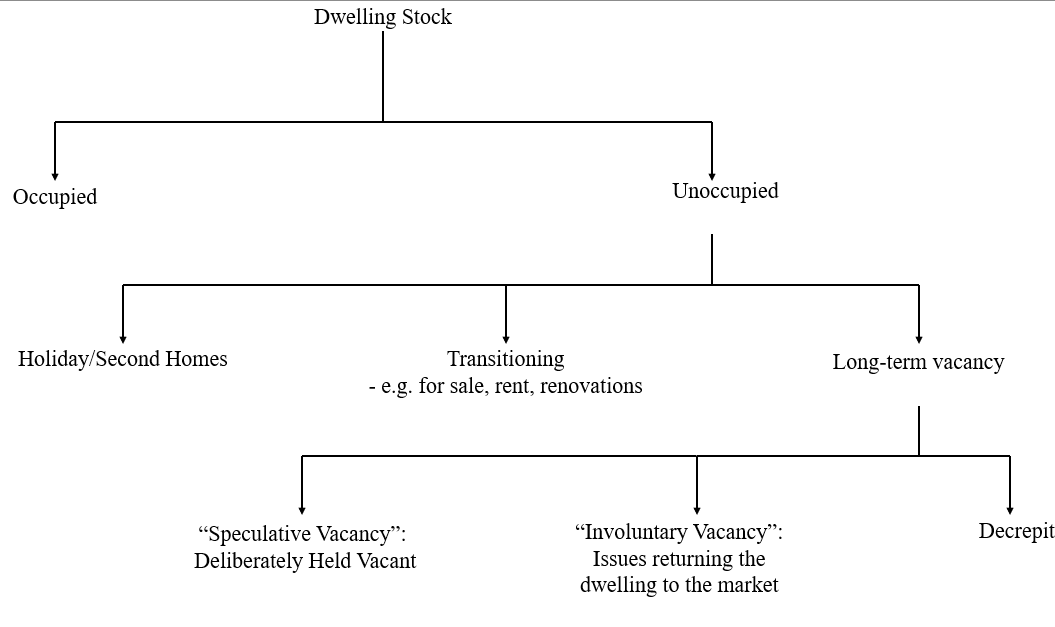
So, we are particularly interested in houses which sit vacant for an extended period of time. We’ll call these “long-term” vacancies. For some, these long-term vacant houses are synonymous with speculation: a deliberate choice to own a property, leave it vacant, and either bank the capital gains or wait for redevelopment opportunities. But, as we’ll discuss below, there are probably many reasons why long-term vacant dwellings sit empty, and it’s inaccurate to describe all of these situations as “speculation”.
I’ve tried to articulate my definitions in the flowchart below. In this blog post, I’m largely going to be focusing on the size of the “long-term vacancy” category. If it is large, then perhaps policy intervention there can be part of the solution. We’ll also try to figure out what the reasons are for this segment of the housing market existing. Why do they sit empty year round, and what proportion of this can be chalked up to “speculation”?
Assessing the evidence base on vacant houses
Let's examine the evidence base for vacant houses in Australia. Two main data sources are often cited: the Census, which suggests around 10% of housing stock is unoccupied, and regular reporting from Prosper Australia, finding about 5% of Melbourne’s housing stock is vacant. As I’ll show below, both claims are based on inaccurate interpretations of the underlying data.
The Census
Every five years, the Australian Bureau of Statistics (ABS) conducts a census that reports around 10% of Australia’s housing stock as unoccupied. These figures attract national media attention and fuel arguments about land banking, second-home ownership, and housing speculation (see, for example: 2021, 2016).
However, these numbers are often presented in a misleading manner. The ABS defines unoccupied dwellings broadly as:
“…structures built specifically for living purposes which are habitable, but unoccupied on Census night. Vacant houses, holiday homes, huts and cabins (other than seasonal workers' quarters) are counted as unoccupied private dwellings. Also included are newly completed dwellings not yet occupied, dwellings which are vacant because they are due for demolition or repair, and dwellings to let.”
As pointed out by our flow-chart above, this definition includes all unoccupied dwellings, including those temporarily empty because they are being sold or rented, which reflects market mobility and churn, not a vacancy. Further, it also includes homes where residents are “temporarily absent”: on holiday, staying with family or a partner, or away for work on Census night.
All these reasons mean that the 10% figure is not an accurate representation of dwellings long-term vacant due to speculation, landbanking, etc, as this is a subset of this larger category. Articles that present the figure in this context are misleading.
This 10% figure is probably an upper bound for the unoccupied dwelling stock (for whatever reason), at a point in time. This declines after we exclude temporarily absent residents. The last detailed data from the 1980s suggested that residents away from home on census night accounted for about 40% of these dwellings (or 4% of the housing stock), so this would imply that 6% of dwellings are unoccupied at a given point in time. Of these, the same data suggests that almost half (2-3% of the housing stock) were holiday homes, and about a third (2%) were in the process of being transacted.
The above data is highly dated (40 years old!) and reflects the issue with Census data: it simply doesn’t have the granularity to shed light on vacant houses. We just see that 10% of houses don’t have someone in them on census night, and aren’t able to tell much else.
Thankfully, given their lack of epistemic value, Census numbers are not repeated as regularly anymore in the discussion about vacant housing (although they still do pop up occasionally) thanks to some good work on these data already (see this report or this article here). In summary, all Census data really show is unoccupied dwellings can't be more than 10% of the housing stock. They do not inform us about the stock of long-term vacant housing.
Prosper’s housing speculation report
A more robust estimate comes from Georgist thinktank Prosper Australia, which periodically publishes a report on vacant housing in Melbourne. Prosper acknowledges the limitations of using census data to estimate vacant housing, noting that “Census counts of unoccupied dwellings are a poor measure of vacancy, since they include ordinarily-occupied homes that are temporarily unoccupied due to the occupant being away or the dwelling being between tenants on Census night”.
Instead Prosper uses water use data at the property level to estimate long-term vacant houses. The argument is simple: if a house doesn’t use any water throughout an entire year, it's reasonable to assume it has been vacant year-round. This metric found around 1.5% of houses long-term vacant in Melbourne in 2023.
I haven’t seen the raw data, and so it’s possible this may include some mismeasurement - demolished dwellings still on the water register, for instance. Regardless, this method broadly seems like a good use of data and is likely in the ballpark of the “true” rate of long-term vacant houses in Australia.
However, Prosper goes further and adds an additional category: “under-utilised” housing, defined as houses that use less than 50 litres of water per day. This dramatically increases the proportion of “vacant” houses to around 5%, totaling approximately 100,000 houses in Melbourne. Although Prosper considers “unused” and “under-utilised” housing separately in the report, this 100,000 or 5% figure is combined as the total number of “empty” houses (see page 14).
Prosper are vague about what an “under-utilised” home means in pratice. They suggest that “under-utilised” homes are likely empty, or only occupied for a small portion of the year. They also suggest these houses can be vacant but still report some water usage due to garden irrigation or a leaky tap. Although this definition is nebulous, I’m going to interpret the category as a home which is unoccupied all or most of the time. The report states:
The 50 LpD measure is a reasonable proxy for under-used homes. It also captures empty homes recording some water use due to leaks or gardening. Any threshold choice results in false positives (inclusion of mostly occupied homes with low water use) and false negatives (exclusion of under-used or empty homes with high use, e.g. due to leaks). Fifty LpD is relatively conservative, given the average water use for a single-person household in Melbourne of around 200 LpD. An occupied dwelling would need to use less than one quarter of this to be counted, which will be rare, while dwellings with average water use occupied for less than one quarter of the year, a reasonable definition of under-use, will be captured.
The issue here is that Prosper is using mean water use to justify their threshold choice, claiming that a legitimately occupied house using 4 times less water than average should be very rare. However, the mean of a distribution on its own tells us little about whether a value is likely to fall within it. To truly understand how likely it is for an occupied household to use less than 50 litres of water a day, we need to know the variance (or shape) of the distribution.
For example, imagine I told you that the average person can only run a few kilometres, and then asked you to predict what proportion of the population could run a marathon. You would be unable to accurately assess this without more information. Data distributions can take various shapes—they can be normal, uniform, Pareto etc. Understanding this is crucial when considering the behaviour of values within the 'tails'—or the extreme parts – of a distribution.
We do, in fact, have some data on the distribution of household water use. Several surveys document water use by installing measurement tools in households, which we know are occupied because they are participating in the survey.
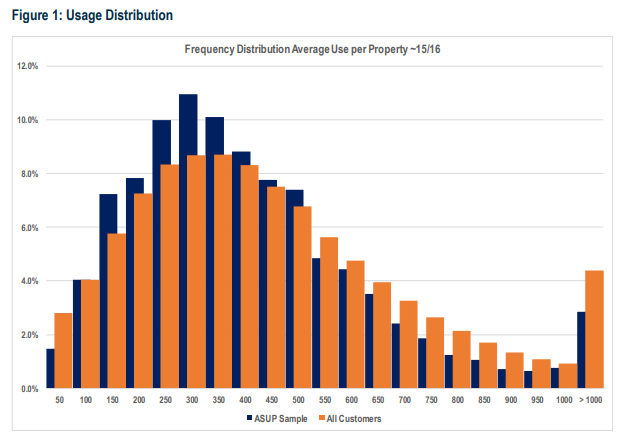
Here’s a study from the Kapiti Coast District in New Zealand, which documented that at least 1.5% of households surveyed used less than 40 litres of water per day (see page 23). Here’s another one from Adeliade which finds one out of 150 households surveyed (0.6% of the sample) used less than 50L per day – with several others not far off from that mark. Finally, here’s one from Queensland that found 4 out of 151 households – or 2.6% of the sample – used less than 50L per person per day (See below chart).

We also have direct evidence from Melbourne. Yarra Valley Water – one of the 3 major water providers in Melbourne that Prosper uses in their report – undertakes regular surveys of their customers, linking their responses and household characteristics to their water bills. About 1.5% of households surveyed in 2016 used less than 50L of water a day. We know for sure these households were occupied because they had to respond to the survey. This may be an underestimate as well, because this part of the water-use distribution seems to have been under-sampled.†
This quick survey of the literature suggests there isn’t a structural reason to think that if we observe a house using less than 50L of water a day it is “under-utilised”. In fact, we’d probably expect a few percent of the population to fall within this range because they are frugal water consumers. Given Prosper’s report is unable to disentangle these frugal water consumers from houses unoccupied most or all of the time, their numbers are overestimating the true stock of long-term vacant houses.
The high variance in household water use makes intuitive sense, as around 40% of water consumption comes from washing machines, outdoor irrigation, and bathtubs. If you look closely at the right tail of the Queensland chart, you'll notice that these households typically lack irrigation systems or washing machines. According to Yarra Valley Water, 1.5% of their reported customers don’t have a washing machine, 53% don’t use a bath, and 30% don’t have a garden.
This variance can be further driven by other factors, such as traveling for work, frequently staying at a partner’s house, showering at work or the gym, or taking long overseas holidays. For instance, if I use 75 litres a day on average as a single person but am home only two-thirds of the time, then I use, on average, 50 litres a day. Similarly, if my house is under renovation for half the year and then occupied by someone using 99 litres per day for the other half, the average usage would be less than 50 litres per day.
These scenarios may seem unlikely, or trivial, but that's part of point. We’re looking at the tail of a distribution, where rare behaviour is, by definition, common. Even small amounts of unusual behaviour make a big difference to the accuracy of their count.
There’s also other evidence that their count is simply picking up occupied households with low water use. Single-person households are likely to use less water for obvious reasons. There’s a strong correlation between their estimates of "under-used homes” in a Local Government Area (LGA) against the proportion of single-person households in that area. This suggests a higher rate of false positives.

Geography might be a confounding variable in this relationship. Areas with more “under-utilised housing” could also have many single-person households and be central to the CBD, where speculators are more likely to leave houses vacant. This is plausible—indeed, Melbourne CBD is at the top right of the chart.
However, when plotting houses using 0 litres per day, the relationship is much weaker. If speculation were the primary driver of this relationship, it’s unclear why ‘under-utilised’ homes would be more common than ‘unused’ homes in these areas.

In fact, we might expect the opposite. Central areas with many single-person households have more apartments which are less likely to have gardens requiring irrigation.* Therefore, if these dwellings are in fact empty, we would expect a greater proportion of them to show up as ‘unused’ (using 0L of water) rather than under-utilised (using some water due to gardening).
I understand that the report faces a challenge in balancing Type I and Type II errors. Setting the threshold too high means undercounting houses that are in fact vacant for most or all the year but still use some water. Undoubtedly, the report’s “under-utilised” measure is picking up some houses that we would reasonably consider vacant. However, the above evidence is compelling that they have set the threshold for water use too high and are picking up too many false positives. There may be just be too much uncertainty in water use data to accurately estimate vacant houses using anything above the 0L threshold.
The significance of mismeasurement here shouldn’t be undersold. We’re moving from 1 in 20 dwellings being long-term vacant, to 1 in 67. Or, from vacant houses being about 3 years worth of new construction, to less than 1. This makes a meaningful difference to how important we treat this issue in policy debates.
How much housing is really vacant?
Our best assessment of the stock of long-term vacant housing comes from recent “experimental” estimates from the ABS. They use administrative data to identify vacant (or "inactive," as they refer to it) dwellings based on two metrics. First, they identify residential addresses that show no signs of recent use in any administrative data source. Second, they use electricity consumption data, identifying dwellings that used no electricity around the time of the 2021 census (May to August 2021). Both estimates suggest that 1.3% of dwellings are vacant.
These figures are still imperfect—hence the ‘experimental’ tag:
Their sample only covers 94% of dwellings across Australia (this may also be a biased sample - in either direction).
The data are also from 2021, when Australia still had a hard international border, possibly trapping some usual residents overseas, inflating the count.
The timeframe for electricity readings is also quite short (a few months) so could be picking up dwellings transitioning between occupants, or undergoing renovations. The survey period was also during winter, when many holiday homes may unused due to cold weather.
This was also a period where the rental market was comparatively loose, so it’s not implausible that some of these dwellings were sitting empty while the owner tried to find a tenant in a renter’s market.
Further work is needed for more accurate estimates. But these figures are in line with Prosper’s 1.5% number from dwellings with no water use, which seems to have been stable over the past decade. And, given the tightness of these ABS definitions, and that their two methods cross-validate, this appears to be our best estimate of long-term vacant stock today.
So, we can now fill out our flowchart with estimates (in some places very rough estimates) of how much housing falls into each category. The potentially problematic “long-term” vacancy category is very small, accounting for 1.3-1.5% of the housing stock. This is less than what we build on average each year. For context, the direct effects of upzoning added about 3 times this amount in new supply over 5 years in Auckland.
On the face of it, it’s unclear as to why such a trivial proportion of our housing stock commands such interest and media attention. As we’ll see below, its also not obvious that we could just put all of this housing back to work through a change in policy.

Why might houses be left vacant?
Before we discuss whether policy solutions are needed to address the few percent of our housing stock left vacant, it’s first worth considering the reasons why they may be left so in the first place.
A common explanation is that housing is left vacant due to the preferences of investors and speculators. There is a literature that attempts to explain why it may be rational for property investors to hold a site vacant. For instance, Prosper argues in their report that:
“On another level vacancy can be explained as a result of inequality – a sign that renters cannot afford to outbid the convenience value of an empty investment property. Some homes remain empty simply because their wealthy owners feel no need to use them. The economic explanation boils down to the relative value of flexibility versus yield. The decision to leave a home vacant depends on the trade-off between option value and cash returns.”
The report later argues that this speculation is part of rational behaviour from private actors and investors in housing markets –potentially a form of “land banking”:
“The reason is that speculation pays. Developing land commits it to a specific use, but delaying banks that option for the future, which can be even more profitable. Development, like renting out a vacant home, means choosing cash over options. This means the true economic (or ‘opportunity’) cost of development includes not only the construction cost, but the foregone value of the option, which is the growth in the price of undeveloped land.”
There are undoubtedly some houses deliberately held vacant by investors. But these arguments imply that vacancy is always a deliberate choice. This mode of thinking almost never considers cost or supply-side factors that force the owner to hold the dwelling vacant, even if they would prefer it occupied.
There are several reasons they may have to leave their house vacant:
The house may be part of a deceased estate, which can take up to a year to resolve. The process of dealing with a family member's death, including moves in and out of aged care facilities and hospitals, can be lengthy. After resolving these issues, it can take another month or so to sell or lease the dwelling. It's not unreasonable to think these dwellings could be unused for over a year, even if the eventual owners wish to put them to use quickly.
The owner may experience an unexpected shock to their finances while their house is undergoing renovations or redevelopment. This could leave a property in limbo: it is unliveable, and the owner would make a loss from selling it in its partially-renovated state. There could also be frictions or temporarily high prices in the market for contractors, making it rational to delay finishing renovations.
There may be delays or uncertainty from the process of getting a DA. An owner may be applying for council approval for a development but are rejected for their preferred option.** They may then hold the dwelling vacant as they reconsider their options, or spend time re-working their proposal.
The dwelling might be derelict or temporarily unliveable due to damage (e.g., from a fire).
The relative frequency of houses left vacant due to “speculation” versus other delays is unclear, and there is a lot of grey area. For example, if an owner buys a detached house, submits a DA for a triplex, gets rejected, and lets the dwelling fall into disrepair as they reconsider their options, is that ‘speculation’, a flaw in the planning system, or just the natural ebbs of markets?
This complexity was highlighted in a recent ABC article which looked into the histories of 11 vacant homes in Sydney:
2 homes had issues with redevelopment processes or financing
1 home was part of a deceased estate
4 homes had issues with council or the DA process
2 homes were owned by the government or a non-profit
1 home was vacant due to the owner’s illness inhibiting redevelopment
3 homes no clear explanation.
These cases illustrate that vacancy is not synonymous with speculation. It's unlikely that our 1.3-1.5% vacant housing stock is sitting unused while the owner simply waits for prices to rise. Instead, it appears to be a mix of complex factors where you can draw out whatever narrative best fits your priors.
Would a vacancy tax help?
A common policy proposal to address long-term vacant housing is to implement a vacancy tax on properties that remain unused for a specified period. The tax could be designed to steadily increase, penalising the owner for longer non-use. This is what the Victorian Government plans to implement from 2025 when they expand their vacancy tax. The New South Wales Government, on the other hand, has rejected such a tax.
A vacancy tax has intuitive appeal. It encourages owners to get their property back on the market quickly, thus increasing housing supply. If they can't, it raises government revenue. Given that land supply is inelastic and it's optimal in the long run to utilise dwellings, such a tax is unlikely to decrease construction and new supply entering the market.
However, there is no perfect policy. Vacancy taxes can be tricky to design and implement, often requiring exemptions for certain activities. For example, we don’t want to discourage renovations or redevelopments, as these improve housing quality and densification. An exemption might be needed for this. Similarly, it may be unfair to tax a property being passed on through a particularly complex deceased estate, meaning another exemption may needed. And so on.
Compounding exemptions and loopholes can defeat the tax's purpose if it becomes easy for speculators to dodge, which has debatably occurred under the Vic Government’s current iteration of a vacancy tax. Identifying whether a dwelling is vacant in the first place is also incredibly complex. As we’ve discussed above, we currently don’t even have a robust way to identify vacant dwellings in existing data. You’d probably have to rely upon a government department manually checking low-utility use dwellings, in combination with other identifiers like neighbour tip-offs.
The effectiveness of vacancy taxes is also unclear. As far as I’m aware, only one study has assessed this. In 1999, large French municipalities introduced a tax on vacant housing, increasing the tax with the duration of vacancy. Comparing areas where the policy applied to those where it did not (using a difference-in-difference approach), the authors found that the tax reduced the vacant housing stock by about 13% (or 0.8 percentage points, given the vacancy rate was 6.32% before the policy). Most of these houses moved back into the market as primary residences.
This suggests vacancy taxes can bring housing supply back to the market. However, the impact was small, accounting for only 13% of vacant units, partly reflecting that the French tax was set at a low rate (10-15% of rental value). The Victorian tax is probably larger, increasing from 1 to 3% of the property value the longer it is left unoccupied. Unfortunately, we don’t have good evidence on how much the tax rate matters in affecting owner behaviour.
What impact would such a tax have on affordability? Let's do some (very) back-of-the-envelope estimates. Our literature review suggests that 1.3-1.5% of Australia’s housing stock is long-term vacant at any given time. Let's say it's 1.5%. Our best estimates suggest that a 1% increase in housing supply decreases rents and prices by around 2.5%. Let’s also assume for simplicity that houses transitioning from vacant to occupied behave just like a newly built house in terms of their effects on rents and prices.
So, if a tax was somehow successful at bringing every long-term vacant house back to the market, this would reduce rents and prices by around 3.75%.
But – as the French example shows – many units would remain vacant even in the presence of a tax. If a tax in Australia had the same effect size (13% of the vacant dwelling stock), the effect on rents and prices would be 0.5% (0.13 x 1.5 x 2.5). Doubling the effect size from France would get us to around a 1% drop in rents and prices.***
The numbers above should be taken in the context of all in which you live and what came before you. I can’t caveat them enough. But they illustrate a key point – it’s hard to see how a vacancy tax would have a sizeable impact on affordability. There simply aren’t a lot of vacant houses to put to use and, given that there are legitimate reasons why houses might be vacant, it’s unclear whether a tax can put them to work in the first place.
This is particularly small in contrast to quasi-experimental evidence that upzoning reduced rents by between 22-35% relative to their counterfactual in Auckland. Or structural estimates that zoning inflates detached house prices by between 42-73% in Australian cities.
Still, a small drop in rents and prices is not nothing. Some may argue that even if it doesn’t bring vacant housing back to market, or reduce prices, it’s still fair to tax owners not efficiently using property. But we have to weigh this up against the administrative burden from enforcing this tax.
There are also alternative policies. A tax on the unimproved value of land would be a broader and politically more difficult policy to implement, but it is highly economically efficient. It would add a cost to a property owner holding a dwelling vacant without good reason. The broad-based nature of the tax would bypass the administrative, measurement, exemptions, and targeting issues inherent to a vacancy tax.
To return to the question I asked at the start of this post: are vacant houses the solution to Australia’s housing problem? Probably not. They may be a consideration as part of a broad policy mix. But governments, advocacy groups, and the media only have finite time and resources to affect policy. With this in mind, it’s not clear that a vacancy tax should be ranked highly within our priorities. It remains that case that any policy solution to Australia’s housing problem requires a need to address zoning and planning restrictions in areas where people want to live.
Notes:
† As can be seen from the chart, the surveyed population under samples households using less than 50L of water per day. It’s possible that this is just due to natural sampling error – it is often tricky to capture small segments of the population in survey designs (high-water users are also under sampled). But it’s also possible that the gap between the surveyed population and the aggregate population is because some of the lowest water use households are vacant, and therefore cannot be surveyed. We would likely need a large sample size to work out whether sampling error or this inability to respond is driving this gap.
*A sidenote on this point related to dripping taps. I tried to understand whether they, on their own, can use enough water to get near the 50L threshold per day. Meta analyses such as this one (see table 1) seem to suggest that leaks account for 2-16L per person per day. I’m unsure if its fair/reasonable to multiply this by average household size of 2.6, giving a range of 5.2-41.6L per household per day. Unfortunately, I couldn’t find the distribution of water use from leaks, but it does seem that in a household without a garden, if the average water use is between 40L-50L per day, it would be more likely to be an occupant than a leak.
Additionally, some data suggests that just 17% of households have a “continuous leak”. It’s unclear whether the above average accounts for this (i.e. the average leak per day is conditional on the household having a leak. If not, then if the household has a leak, then they are using 1/0.17 x the “average leak”). Regardless, given this probability, if the Prosper methodology were accurate, amongst truly and entirely vacant houses without gardens, we would expect there to be almost 6 “unused” to 1 “underutilised” houses. This is not what they find in dense areas.
** An attentive reader may note that upzoning may be a policy solution to this.
*** It’s worth noting that the French study found no effect of the vacancy tax on house prices in the short run, and a positive effect in the long-run. However, they de-emphasise these results due to potential differences between their treatment and control group for this particular DiD approach. Their methodology was mainly designed to deal with vacancy rates, not prices.