Housing supply in Auckland hits an inflection point
Key Points:
Upzoning in Auckland has already been a success. Research has found that it has materially increased the stock of housing, and rents have declined in real terms.
Building completions in Auckland lag behind consents by about two years, which means that a spike in completions is expected soon, mirroring the surge in consents that began in December 2020. This could put further downward pressure on rents and prices.
There is a possibility that the number of completions may not be as high as expected due to lower house prices and higher interest rates, as developers may choose to delay construction until conditions are more favorable. However, the available evidence suggests that this is not happening, and completions are continuing to track consents.
Even if the number of completions does not match the number of consents, the overall stock of housing will still increase at a record rate. Based on different assumptions, it is estimated that Auckland will add between 30,000 and 35,000 dwellings over the next two years, increasing the dwelling stock by 5-6%.
Additionally, there is no evidence that dwelling consents are declining; in fact, the average is still increasing.
The story so far
Over the past year, I have written and researched extensively on Auckland's upzoning as a solution to improve housing affordability. One of the benefits of studying Auckland is the clarity and simplicity of the story. The City Council upzoned 3 quarters of suburban land in late 2016 through the Auckland Unitary Plan (AUP). Multi-unit construction skyrocketed. Causal analysis shows that this was because of the AUP. The New Zealand Government added more fuel to the fire by passing 2 other nationwide, world-class, housing supply reforms in 2020 and 2022. Construction continued to grow. Rent-to-income ratios fell. Then real rents fell. Now nominal rents are stagnating. These effects can be seen in the following 2 charts.
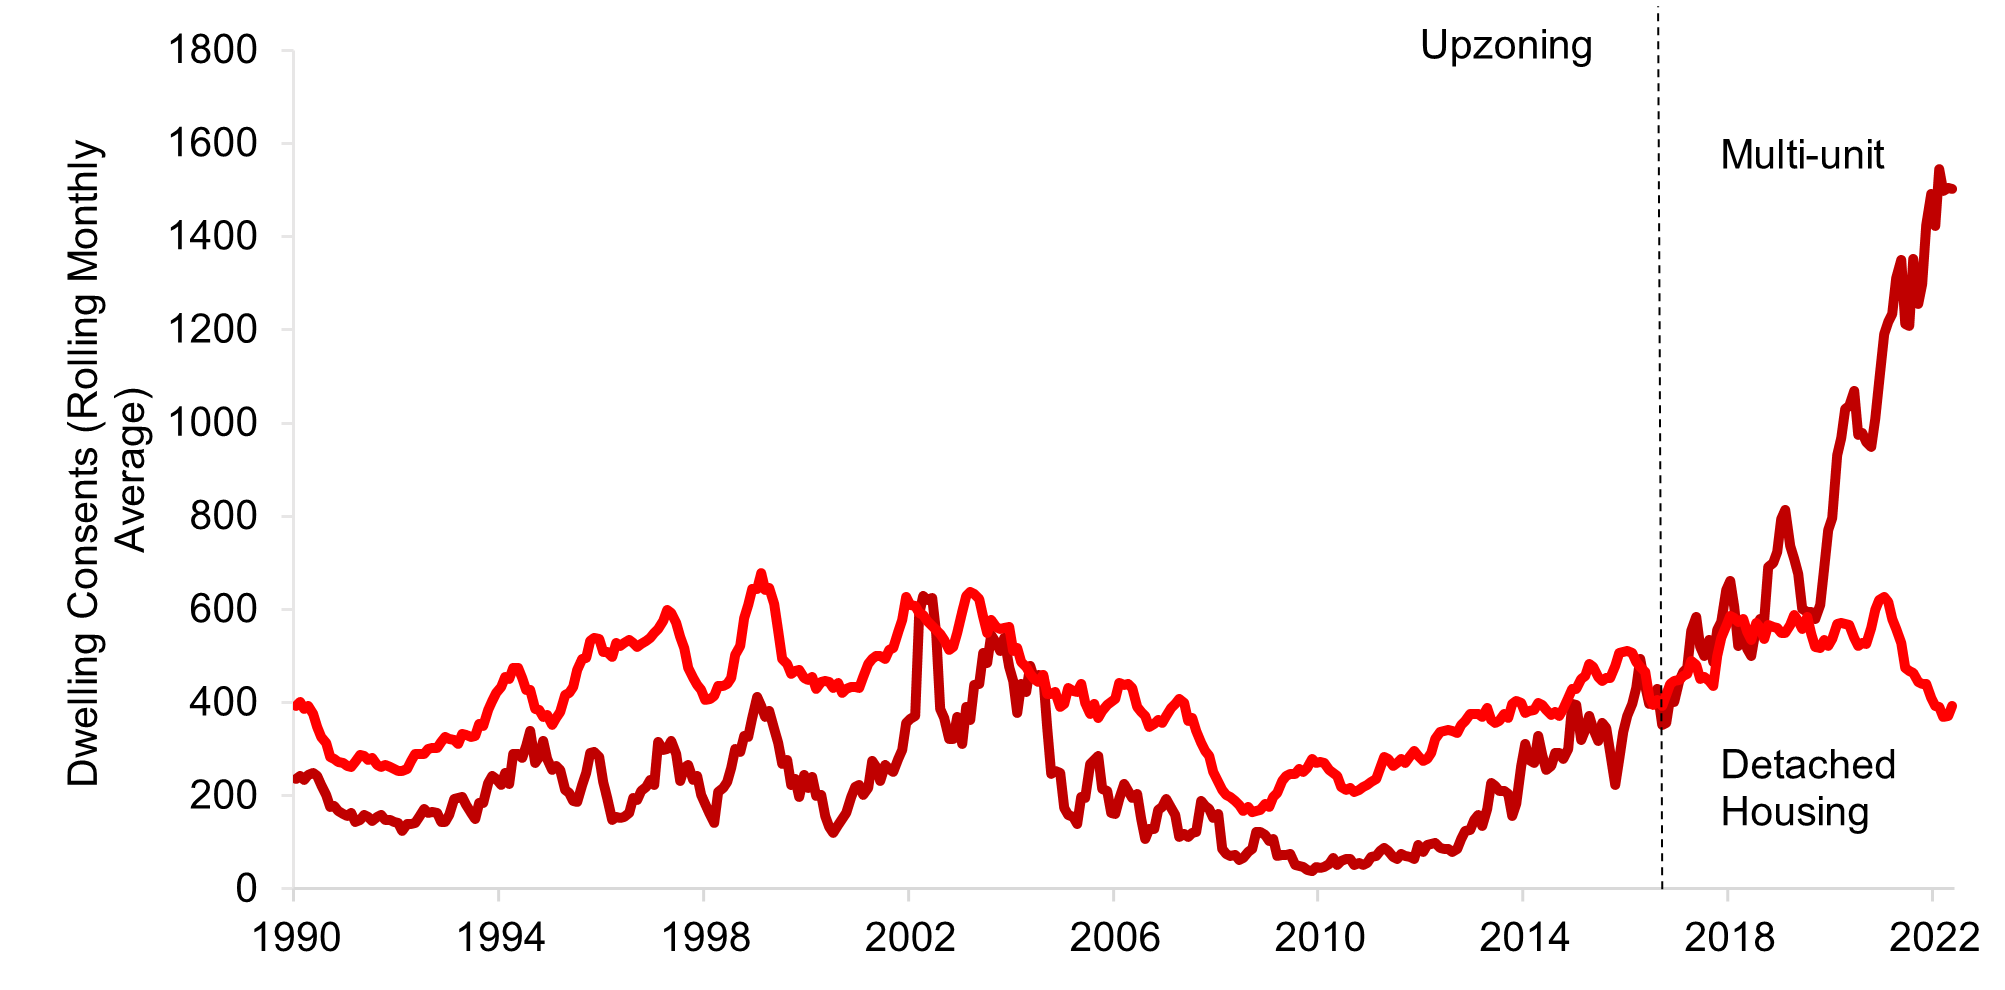

It is worth noting the improvement in affordability may not be solely due to increased supply. Auckland's population has been marginally decreasing for the past two years, possibly due to lockdowns and closed borders. However, rent-to-income ratios began to fall before then.
The results so far are impressive. But, it is possible that the next two years could be even better.
Supply hits an inflection point
Most people, including myself, look at data on approved housing units rather than completed units when analyzing housing supply. This is because the data on approved units are more responsive to policy changes and are easier to find. Completed units do not usually differ greatly from approved units, so they do not add much new information. There are exceptions, such as during the early years of the COVID-19 pandemic in Australia, where the HomeBuilder policy and lockdowns led to an unusually high number of units under construction but not completed.
In general, completed units lag behind approved units by about two years. This seems to be true in most housing markets, and it is particularly evident in New Zealand. In Auckland, there is a strong correlation between the rolling average for completed units and the average for approved units two years earlier. There is some minor variation when the number of approved units is higher, but overall the data tracks closely.

Chart uses point in time rolling averages for completions and consents.
So why are the number of completed housing units important? The number of completed units reflects the actual stock of housing available on the market, which determines affordability. Because there is a strong correlation between completed units and approved units, we can project the number of new housing units that will be available on the market over the next two years. The chart below shows why this is relevant right now: the number of completed units is about to reach an inflection in the data on approved units. About two years ago, in late 2020, the number of approved units began to surge, reaching an average of over 20,000 per year, an increase of about 40%. This indicates that a large number of new housing units will be available on the market in the coming years, which will likely have a positive impact on affordability.

(An aside - if you are wondering why the impact of upzoning does not appear as significant on this chart compared to the first chart on approved units, it is because the chart only shows a shorter time period. The number of completed units decreased during the global financial crisis. The rate of completed units doubled from 2013 to 2016, but this was mainly a return to the historical average.)
But, is this a fair assumption: that the number of completed units will roughly track the past two years of approved units - and there will be an influx of new housing units on the market in Auckland?
Will Completions slow down?
There are several reasons why the number of completed units may not match the number of approved units:
Rising interest rates may cause some ongoing projects to be unprofitable, leading to delays due to financing issues.
Increased demand for construction across New Zealand may push up costs, causing some developers to delay building.
Lower house prices may lead some developers to postpone building or not start construction on approved lots until prices rise and the market becomes more favourable.
Additionally, some may argue that property owners will not "flood the market" with new housing units and push down prices, a phenomenon known as landbanking. I will not discuss landbanking in detail here, but I believe it is more likely to occur in greenfield areas where developers have significant market power and less likely to happen in urban areas with diverse land ownership, like Auckland. It is unlikely that hundreds of thousands of property owners would be able to coordinate construction to inflate prices.
But, instead of speculating on theories, let's look at the actual data to see if there is any evidence of a growing gap between completed and approved units. We should see some evidence of a gap if it is indeed happening: interest rates have been increasing since 2020, house prices have been decreasing, and the number of approved units has been skyrocketing across the country.
First, let's examine when completed units began construction. The chart below shows the proportion of new completed units that were approved within the previous two years. If there are delays in the construction sector, we would expect more new completed units to have taken longer to build, indicating that they were approved more than two years earlier. The data does not suggest that the current completed units are significantly different from historical norms.

Next, let's look at how the gap between approved units and completed units has changed over time. The left-hand side shows the absolute number of units in the gap, while the right-hand side shows the gap as a percentage. The gap has been growing since late 2020, but it is not unusually large. Additionally, it seems that the gap moves in cycles: there is a buildup of approved but unfinished buildings, which then become available on the market. It is possible that the gap will be reduced throughout 2023. Overall, there is some evidence that the market may not be able to complete all the new approved units on time, but nothing conclusive.

(Note that the ‘gap’ in these charts is the gap between the yearly rolling average numbers).
Finally, let's look at how changes in house prices might be related to the gap. In a "rising" market, we could expect the gap to shrink as developers rush to bring new construction to market to take advantage of higher prices. In a declining market, they may build more slowly. A landbanking theorist may argue that this is to suppress supply and increase prices, but it could also be a result of builders taking more time to manage the costs of inputs and not rushing development. Regardless of what you believe, there is no significant correlation between the gap and changes in house prices.

This chart uses the gap in the 12-month rolling average of consents and completions on the x-axis.
Overall, there is little evidence to suggest that the number of completed units is diverging from the number of approved units, at least for now. It’s possible this may change in the new year - but we haven’t seen it yet.
What do the next 2 years hold?
Given that we know that completed units generally track approved units, we can try to project the number of new housing units that will become available in Auckland over the next two years. This is not an exact science, but I have modeled three scenarios. The first is a "best-case" scenario, where completed units are around 92% of approved units, which is the historical norm for the proportion of completed units to approved units. The second is a "medium" scenario, where completed units reach 86% of approved units, which is where they are currently. Finally, a "worst-case" scenario, where we only reach 75% of approved units, and the gap grows well above historical norms.
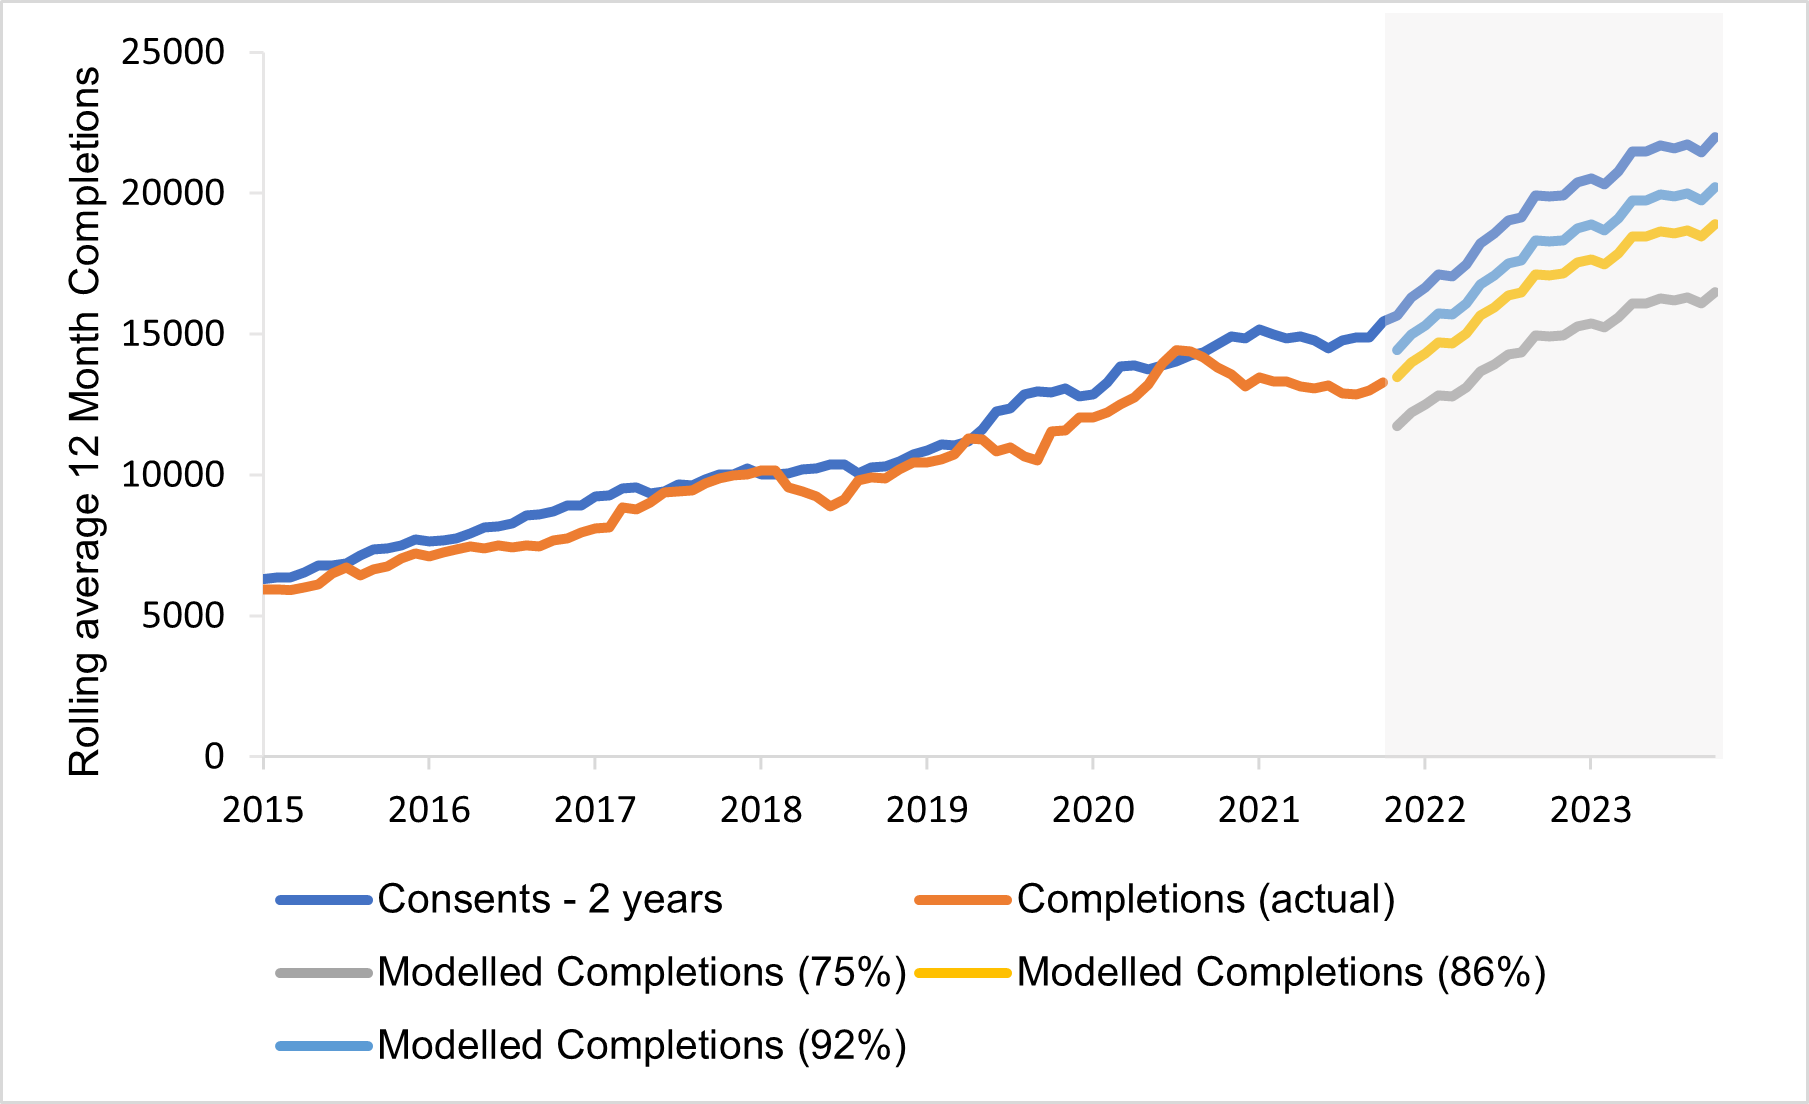
If we take these projections as a range, it means that Auckland will add between 29,200 and 36,000 housing units over the next two years. This is significantly more than the 21,000 units added in the three years prior to upzoning. Auckland's housing stock will increase by between 5% and 6%, or between 16 and 20 units per 1,000 people*. This should have a significant impact on affordability, beyond what we have already seen.
One interesting question is whether Auckland will build more than 20,000 units in a single year in the next few years. This would be unprecedented, as the previous high for approved units was around 13,000 before upzoning, so I am inherently sceptical. But it’s more more plausible than you might think. The current average number of approved units per year is 21,985, so hitting 20,000 would require completed units to be around 90% of approved units, which is not historically abnormal. Additionally the number of approved units is still increasing. If approvals hit around 23,000 per year, the possibility of completing over 20,000 in the 2 years following would be more likely.
Upzoning in Auckland has defied many expectations of how housing markets behave. Despite facing challenges such as rising interest rates, high construction costs, and falling house prices, both housing completions and consents have continued to rise. This is a testament to the power of upzoning to increase the supply of housing, even in challenging economic conditions. It shows that when people are given the opportunity to build more housing, they will do so, leading to increased supply and improved affordability. This has been a significant success for Auckland and a valuable lesson for other cities looking to improve their housing markets.
*Note these numbers (as well as the comparison numbers) assume no demolitions, as there is no data available on demolitions in Auckland.